Component B
External Collaboration and Coordination
Implementation Steps
B.1 Planning and Programming
The steps in this subcomponent will assist an agency in collaboration with partners to establish a strategic direction and guide planning and programming processes. For this subcomponent, each implementation step is cross-referenced with other implementation steps from other subcomponents.
- Engage with external stakeholders to establish goals, objectives, and measures
- Collaboratively establish targets
- Develop and implement strategies in a collaborative manner
“Specifically, State DOTs, MPOs, RTPOs, and transit agencies need to align their goals, objectives, measures, and targets with one another. This does not mean that each agency must use the same goals, objectives, and measures… However, it is important that goals and objectives of various transportation agencies working in the same areas are supportive of each other.”
Source: FHWA, Performance Based Planning and Programming Guidebook
Step B.1.1 Engage with external stakeholders to establish goals, objectives, and measures
Goals and Objectives
Before beginning the process of selecting goals, objectives, and measures, staff should have an understanding of how the transportation system is performing to frame the discussion about long-term transportation trends, needs, and desired future conditions. Collaboration with external agencies is a key way to obtain this understanding from a broad set of perspectives. Agencies should engage partners and stakeholders like State DOTs, MPOs, RTPOs, and transit agencies as well as local government, the business community, and economic development organizations. Examples of engagement with such partners and stakeholders can be found in FHWA’s PlanWorks resource.3
Discussions should include historical, current, and forecasted performance conditions. Discussions should also cover varying interests and needs for development of performance-based plans such as the Transportation Asset Management Plan (TAMP), Strategic Highway Safety Plan (SHSP), and Freight Plan in addition to development of long-range plans. SHSPs are an example of where effective collaboration and coordination among law enforcement, transportation engineers, and policy makers has produced results. Crash reporting by law enforcement provides the data necessary for transportation agencies to identify high crash areas. With this information, agencies can develop strategies to improve safety and reduce crashes. SHSPs establish goals, objectives, and strategies related to safety. Goals and objectives should be discussed with partner agencies to ensure activities undertaken by partners are supportive of each others’ goals.
“It took a full year working with local partners, consultants, stakeholders and the public, but we now have a collaborative performance framework for the region.”
Source: Monique de los Rios-Urban, Maricopa Association of Governments
The public and other stakeholders must also be engaged through the goal-setting process to ensure agency goals reflect regional priorities, particularly during long-range plan development. Stakeholder engagement is also an opportunity for the agency to clarify the linkage between core agency functions and broader societal concerns and discuss the relative priority of goals. Input from stakeholders should be used to refine goals and objectives so that they resonate outside of the agency.
In addition to making the goal-setting process more relevant, external engagement is also Federally required as part of the transportation plan development process.4A,4B For example, MPOs developing the MTP must consult, as appropriate, “…State and local agencies responsible for land use management, natural resources, environmental protection, conservation, and historic preservation.”5 States developing the LRTP must consult with MPOs, regional transportation planning organizations (RTPOs), Tribal governments, and state and local agencies.6 Any interested parties should be included, as well as the general public, transportation providers, and representatives of system users.7A,7B
“The biggest barriers to collaborative performance-based planning and programming are organizational and institutional. Therefore, strong support from upper management can make a significant impact.”
Source: NCHRP 8-36 (104), Performance-Based Planning and Programming Pilots
Items to keep in mind when collaborating and coordinating on the development of goals and objectives:
- Document planning timelines to more easily identify opportunities for collaboration
- Ensure a diverse group of stakeholders are invited to participate
- Establish working groups or similar structures with the primary purpose to develop goals and objectives
- Consider how each agency or partner will value particular goals
- Support staff participating in collaborative efforts by reducing workload temporarily
Cross reference: Component 01: Strategic Direction, step 1.1.3
Measures
Once the agency has established goals and objectives and understands what data are available, partners can be engaged to identify and define performance measures. Obtaining input from various groups will help identify opportunities to use the same measure across multiple agencies, which can streamline how data are collected, managed, and analyzed. In some cases, it is feasible to reconcile similar measures used by partners into common measures. Be prepared for situations where partner agencies, while using similarly-named measures, are actually using different underlying calculations. Even though using the same measures across agencies may improve data interoperability, agencies should be careful not to use measures only because data already exist or the measures are more affordable. Measures must be meaningful and add value to the later processes of target setting, planning, programming, and monitoring to produce results that meet the expectations for the traveling public, businesses, and communities. It is also important to consider how readily understood measures will be by the public. Reporting will be easier if measures are inherently straightforward; however, some measures that are good for public consumption fail to be useful for internal agency management.
Collaboration and coordination between State DOTs and MPOs can be beneficial because these agencies have traditionally used measures for different purposes: State DOTs to track trends in asset condition and direct outputs, and MPOs for forecasting and alternatives planning. A robust TPM practice requires both.
Discussion with partners should:
- Engage technical and nontechnical individuals
- Determine whether measures are forecastable or measurable with existing tools and data
Cross reference: Component 01: Strategic Direction, step 1.2.2
Examples
Public Engagement for Goal Setting: Binghamton MPO8
Spurred by a declining population and the need to update the LRTP, the Binghamton Metropolitan Transportation Study (BMTS), the MPO for the Binghamton, NY region, undertook an extensive external engagement process to identify community goals. Their first step was to create a Community Vision Team that included a representative cross-section of the community:
- Students and administrators from Binghamton University
- Human service providers
- Elected officials
- Business and economic development representatives
- BMTS staff
Facilitators presented the team with summaries of goals from local planning and economic development documents to discuss in a series of meetings. While there were some challenges in keeping all members of the team continuously engaged, the biggest challenge was convincing local elected officials and planning staff from different agencies to participate in a cooperative dialogue.
The previous LRTP lacked a clear community vision, but the updated plan reflects the goals proposed by the Community Vision Team, emphasizing how external engagement can link community goals to agency planning. In a reminder that internal buy-in is also critical, those involved noted that success hinged on the support of the MPO leadership who approved a departure from traditional methodology.
Cross reference: Component 01: Strategic Direction, step 1.1.3
Partner and Public Engagement: MTC PlanBayArea 2040
The Metropolitan Transportation Commission, the MPO for the San Francisco Bay Area, is currently updating its Regional Transportation Plan, known as Plan Bay Area 2040. To engage external stakeholders, MTC assembled a Performance Working Group comprised of representatives from cities; counties; transit agencies; congestion management agencies; the state; economic, equity, and environmental organizations; and members of the Policy Advisory Committee, made up of citizen representatives. This comprehensive group was engaged to develop goals and performance targets for the plan update.
To inform the working group, staff led public workshops during which goals from the original Plan Bay Area (adopted in 2013) were presented as a starting point; attendees voted for their top three most important. Once voting was complete, individuals were asked what goals were missing and wrote their ideas on sticky notes to assemble on the wall. This low-tech word cloud was assembled into the digital version shown in Figure B-2, with word size indicating the relative number of comments posted by participants.9
Figure B-2: MTC Collaborative Goal Setting
Source: Plan Bay Area 2040 Spring 2015 Engagement Report10
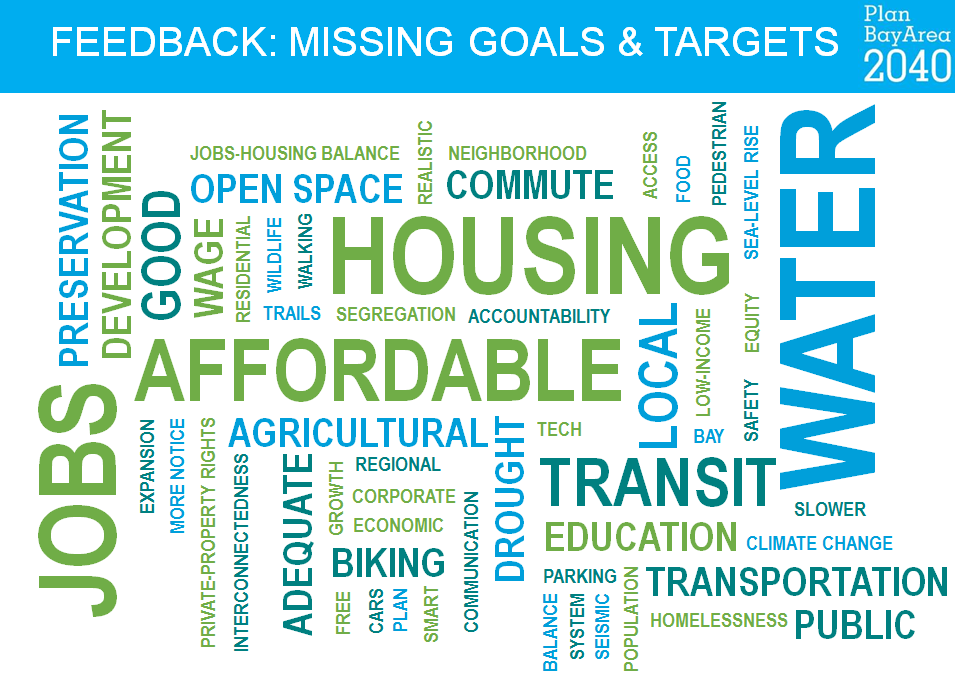
Water was a top goal area because of the ongoing drought. MTC staff noted that social equity, in terms of affordable housing, was elevated as a major concern in this RTP cycle, while economic vitality was a lower priority because of the current strength of the area’s economy. This engagement process demonstrates how important it is for an agency to engage stakeholders on an ongoing basis because priorities can and do shift based on changing conditions. Staff also note that stakeholder understanding of the impact of this process has increased each cycle; selection of goals can be contentious because stakeholders know that plan goals do in fact determine which projects are funded and how discretionary funding is allocated.
Cross reference: Component 01: Strategic Direction, step 1.1.3
Measure Selection: Maryland Attainment Report Advisory Committee
As of 2000, Maryland law requires publication of an annual Attainment Report that includes performance indicators to track progress toward achievement of goals and objectives in the Maryland Transportation Plan (LRTP) and the Consolidated Transportation Program (6-year capital budget).11 The law was updated in 2010 to create an Attainment Report Advisory Committee comprised of specific stakeholders such as:
- A representative of rural interests
- A representative of an auto users group
- A representative of a transit-user’s group
- A nationally recognized expert on pedestrian and bicycle transportation
- A nationally recognized expert on transportation performance management
- And others
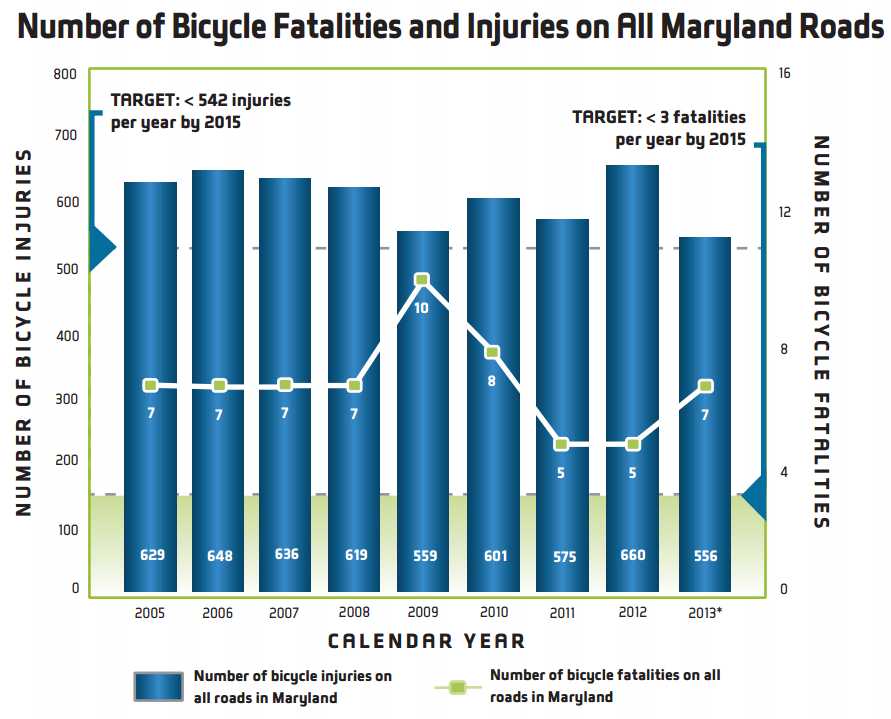
The committee is charged with reviewing use of performance measures in other states to advise MDOT on goals, benchmarks, and performance measures. An example of such a measure is below in Figure B-3. MDOT staff as well as staff from the modal administrations within the department work with the committee to develop performance measures each time Maryland’s long-range plan is updated or every three years.
Figure B-3: Measuring Safety for Bicycle and Pedestrians at MDOT
Source: 2015 Annual Attainment Report12
Cross reference: Component 01: Strategic Direction, step 1.2.2
Linkages to Other TPM Components
- Component 01: Strategic Direction
- Component 02: Target Setting
- Component 03: Performance-Based Planning
Step B.1.2 Collaboratively Establish Targets
The first step in establishing targets is to assemble data to develop a baseline for selected performance measures. Partner agencies should initiate discussions to determine what data are available within each agency’s data system. Understanding what data are available will be helpful to determine what information can be considered as a baseline is established.
Working groups can be established to coordinate target setting; members of these groups should include DOT, MPO, and transit agency staff, as well as staff from other partners. With a formalized group dedicated to cross-agency collaboration, work is more likely to be sustained. Ensure working group members have support from management and leadership to dedicate the necessary time to such working groups so that each meeting can be productive. For performance areas that are heavily affected by influencing factors, consider including representatives from non-transportation partners to understand the impact of these influencing factors on historical and projected performance. Often these partners will bring information to the table that allows understanding of why trend data varied over time.
Working groups should continue to meet even after targets have been established. This will promote closer collaboration in the future as targets are updated and performance data are monitored to determine target attainment.
Consider starting with a single performance area to build the processes and structures for collaboration and coordination. Once any challenges have been addressed, expand to other performance areas.
Data consistency can be an obstacle to collaborative target setting. If partners are using different data sets, baselines and forecasts may differ. To overcome this obstacle, consider using grant money or other funding to make a single data set available to all partners.
Collaboration in target setting could also take the form of benchmarking with peer agencies. Gathering target information from peer agencies can clarify regional and national trends in specific performance areas, create a context for a target, and help explain a proposed target’s value to external stakeholders. However, to properly bring external target values into an internal agency’s target setting process requires accurately identifying peer agencies (or clearly explaining the differences), confirming that similar data sources were used, and ensuring consistent measure definitions were applied.
As with any process in TPM, it is vital to document the steps taken, staff involved, and roles and responsibilities. Because targets will need to be updated regularly, having this information documented will make updates straightforward and efficient.
Other collaboration and coordination techniques include:
- Obtain agreement among partners concerning assumptions and inputs to models
- Hold working group meetings on a regular basis to prevent coordination from losing momentum
- Invite State DOT representatives to sit on MPO boards
- Compose a joint statement of understanding regarding data sources, desired outcomes, and other assumptions
- Promote data consistency by using grant money or other funding to make data available to all partners
- Define roles and responsibilities both within and across agencies to ensure all offices are engaged13
Examples
Understanding Tolerable Thresholds: MoDOT
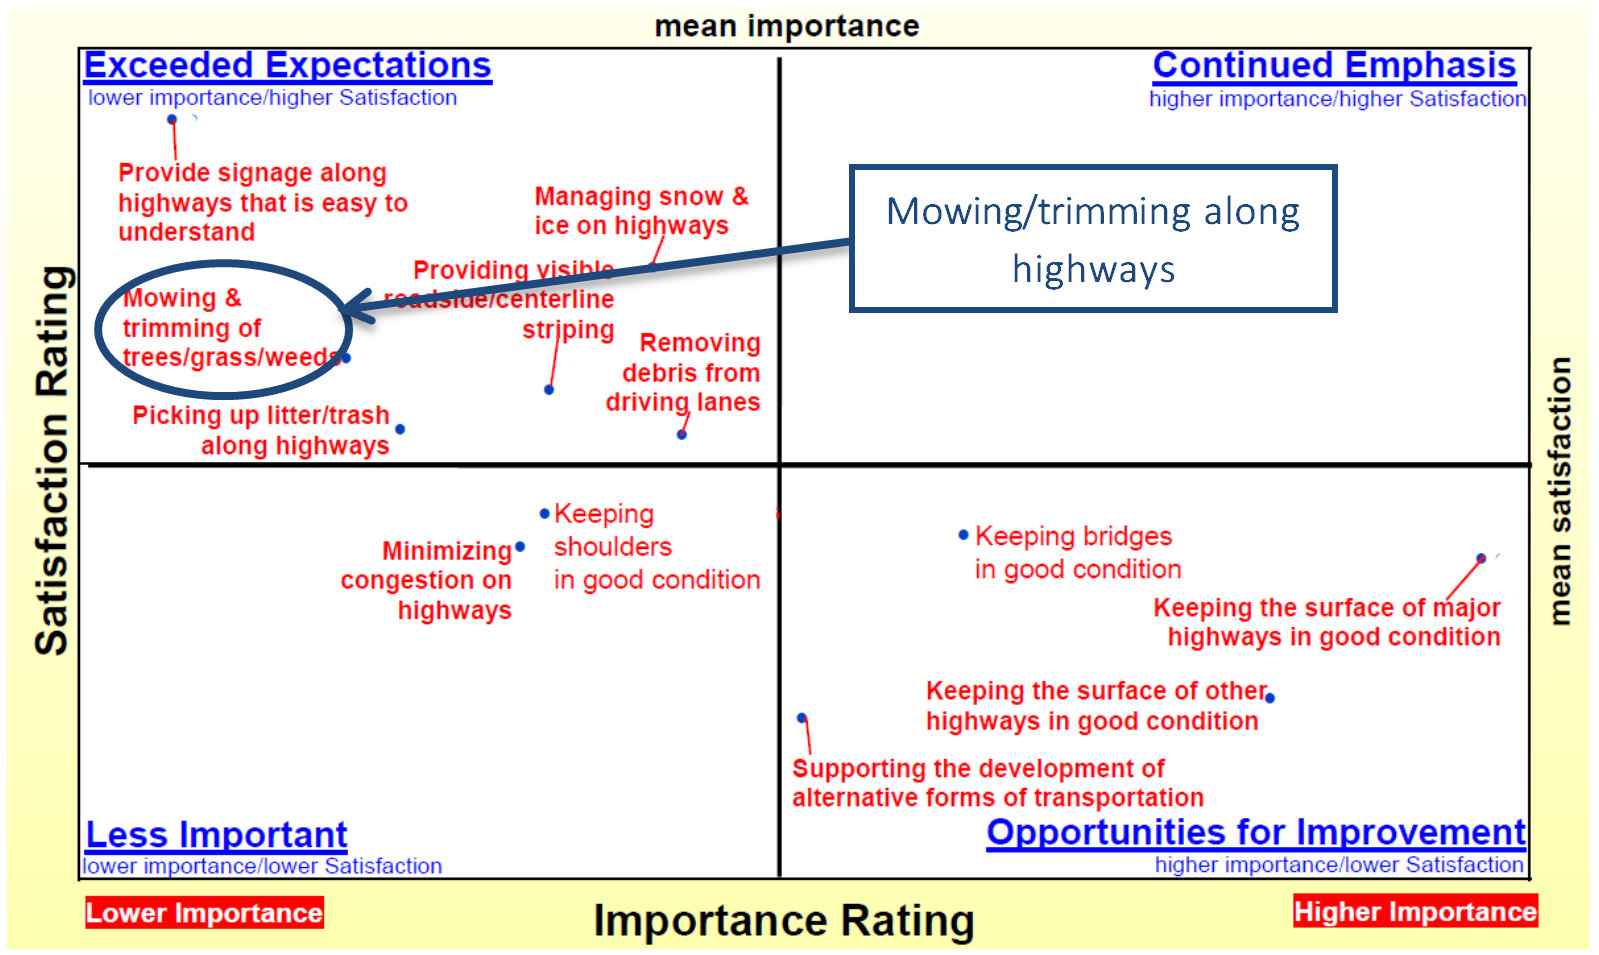
Missouri DOT’s customer report card includes an importance-satisfaction analysis that plots the percentage of Missourians who indicated a service offered by MoDOT as very important against the percentage of Missourians who were very satisfied (or dissatified) with that service. The simple graphic provides guidance on where to focus resources. For example, in 2010 when the agency was facing a notable funding shortfall, the importance-satisfaction chart highlighted an opportunity to shift resources from one service to another. As the figure below from 2010 illustrates, Missourians were relatively satisfied with MoDOT’s mowing/trimming services, but overall this was of less importance to citizens than other services. Subsequently, MoDOT reduced its mowing practices from four to three times a year resulting in $2.5 million in savings that was reallocated to other system performance areas. The next survey showed this maintenance practice change had zero effect on customer satisfaction. This information is important to know as the agency sets targets for performance in various areas.
“Public opinion surveys can also be helpful in the target-setting process to understand the relationship between different transportation system performance levels and the level of inconvenience or discomfort perceived by users.”
Source: NCHRP 551: Performance Measures and Targets for Transportation Asset Management (Vol II, pg. 34)
Figure B-4: Satisfaction v Importance of Agency Activities
Source: Adapted from A Report Card From Missourians (2010)14
Cross reference: Component 02: Target Setting, step 2.2.4
Target Setting Collaboration: WSDOT15
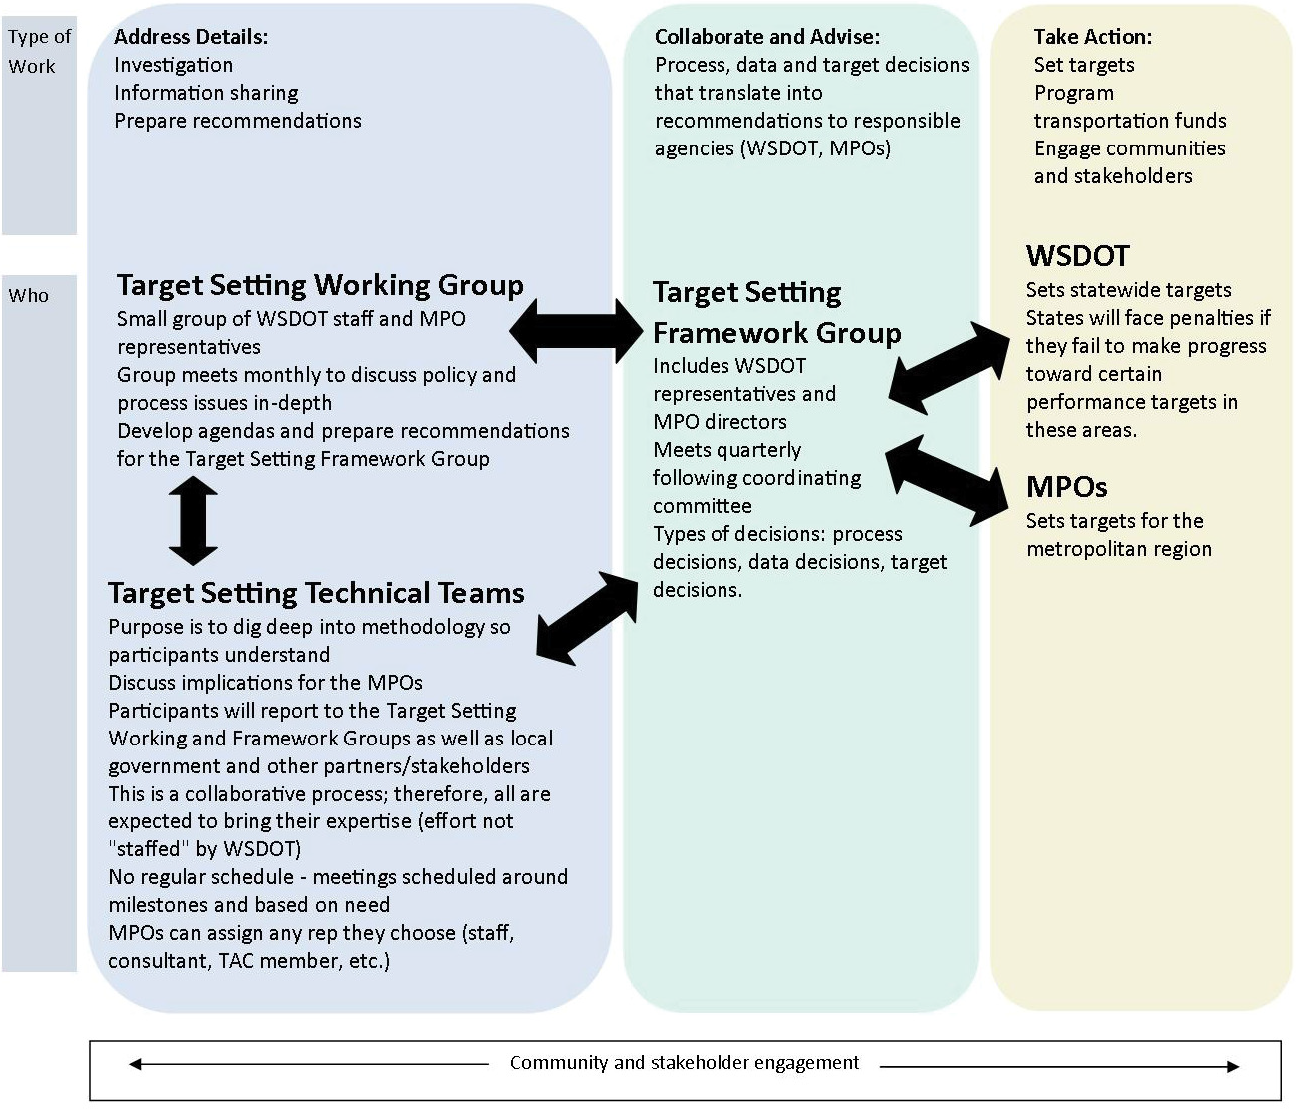
The Washington State DOT has established three groups to facilitate collaborative target setting. The Target Setting Framework Group includes representatives from WSDOT and directors of MPOs and meets quarterly to address issues in three categories: process, data, and target setting.
- Process: the group will decide when and how often WSDOT and MPOs should engage and how to engage.
- Data: the group will determine what types of data to use, establish roles and responsibilities for data collection and analysis, and the process MPOs should use to report targets and results.
- Target setting: the group will advise on target setting decisions, with final recommendations forwarded to MPOs, WSDOT’s Executive Leadership Team, and the Secretary of Transportation. Agencies can adopt or modify the targets, but the Secretary must ensure they align with the Governor’s strategic directions.
The Target Setting Working Group, a smaller group comprised of WSDOT and MPO staff, meets monthly to discuss policy and process issues more in depth to prepare recommendations for the Framework Group.
Target Setting Technical Teams go into more detail, using NPRMs to prepare for new requirements by analyzing and vetting WSDOT proposed targets. Each national performance area has a technical team that reports to the Working Group and Framework Group and individual members report back to WSDOT, their MPO, and local government partners. Technical Teams meet as needed, mainly around milestones.
Figure B-5: WSDOT Target Setting Collaboration Structure
Source: MAP-21 Collaboration, May 2015 – Edition 116
Coordination in Target Setting for California Greenhouse Gas Emissions Reduction
California has formally established performance targets related to greenhouse gas (GHG) emissions reductions. This was done largely as a result of state legislation requiring GHG reduction targets, which resulted in a statewide effort to identify a set of common performance measures.
As a result of the legislation, the California Air Resources Board convened an MPO and state agency working group to talk through the target setting process. An advisory committee of 21 members with representatives from MPOs, housing agencies, ARB, environmental justice groups, and others provided recommendations on how to establish targets. It was important to all these agencies that target setting not be done in a top-down manner. Throughout this process, each MPO conducted modeling to report on the GHG reduction progress it expected to achieve. For example, San Diego Association of Governments, the MPO for San Diego, had relatively sophisticated modeling and forecasting capabilities and therefore was able to analyze various pricing strategies and model expected impacts on GHG reduction targets for cars and trucks.
In addition to the working group’s efforts, bi-monthly meetings of planning directors from all MPOs in California kept the momentum going for a collaborative target setting process, while the executive directors of large MPOs meet quarterly to exchange assumptions and talk through the key issues they are facing. Even though all regions have now set GHG performance targets, the working group continues to meet.
The various coordination efforts between state agencies and MPO to set GHG targets has positioned Caltrans and California’s MPOs to work within existing structures for strong coordination in setting other performance targets.
Linkages to Other TPM Components
Step B.1.3 Develop and implement strategies in a collaborative manner
While selecting goals and measures and establishing targets in collaboration with partners is important, it is critically important that collaboration and coordination continues through the development and implementation of strategies. Major efficiencies can be leveraged through coordination in this realm especially concerning cross-jurisdictional and multimodal projects. The issue of internal and external agency silos is a common problem, and staff should attempt robust collaboration to overcome this obstacle.
Proactive communication through programming will enable partners to capitalize on synergies and avoid conflicts. A resurfacing project can be combined with pedestrian improvements undertaken by the transit agency around a station to avoid construction disruption over two separate time periods. Or reevaluation of traffic signal timing can be coordinated with a bike lane and signal installation study. A formal input process for collecting project information should be established to simplify the process.
Once effective processes for communication, collaboration, and coordination have been identified, document how they were completed. This will ensure proactive communication continues despite staff or other changes.
“The collaboration issue is huge – however, to be successful you need to identify and address the institutional barriers within agencies that prevent it from happening.”
Source: Susan Sharp, Sharp & Company
Agencies that have begun this process of collaborative planning and programming agree that incremental process improvements are valuable, and agencies should not wait until the ideal approach is possible. Additionally, collaboration seems to break down at the point when one agency becomes responsible for funding and implementing a particular project because results of collaboration must compete with other priorities within the agency. To combat this, an agency should try to maintain coordination at both upper management and technical levels.17
The public and partners both will play a key role in examining alternative investment and policy scenarios, and partners will provide input to inform the selection of preferred strategies. Within this process, stakeholders can rely upon performance information and the results of analysis from the agency to help in understanding the implications of different investment and policy scenarios, and can react to these results and express preference.18
“There is a lot of emphasis on external collaboration during transportation planning, but it seems to fall off during programming. Agencies should do as much during programming as they do during planning.”
Source: FHWA Planning Staff
Examples
Staff at the Mid-America Regional Council (MARC), the MPO for the greater Kansas City area, developed an online template library to gather calls for projects for programming efforts.
Figure B-6: MARC Project Templates
Source: MARC Transportation Department19
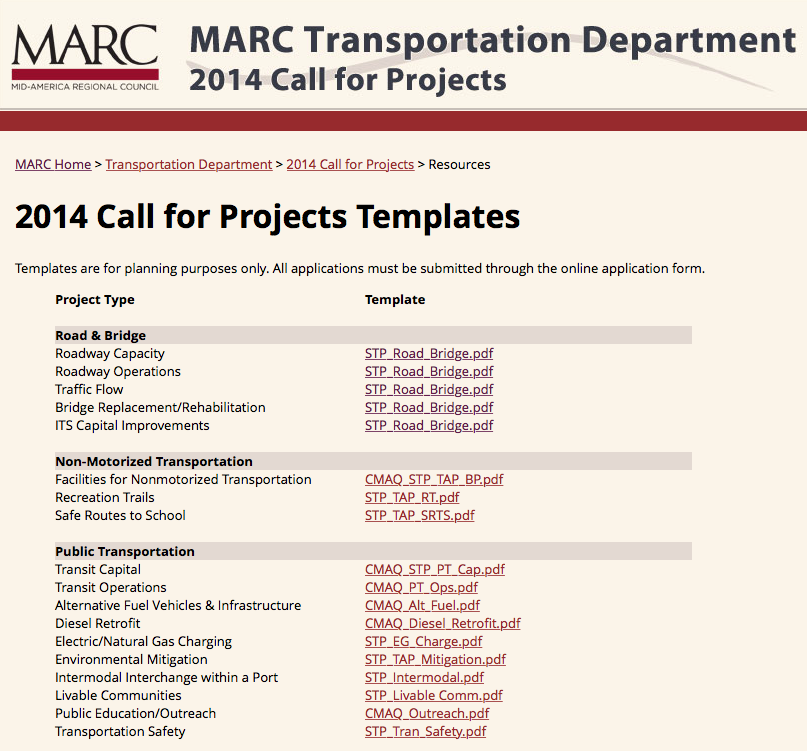
The online call for projects page is currently in use for multiple plans, including MARC’s Surface Transportation Program 2017-2018, Transportation Alternatives (TAP) 2014-2018, and Congestion Mitigation and Air Quality Improvement Program 2015-2018. Projects are evaluated based on how closely they align with policy goals, making clear the connection between goals and programmed projects.
The input uses a menu to gather basic information on the project such as program, location, need, modes, description, usage, and relationship to or inclusion in a number of other plans. This allows MARC to receive a large amount of information from a large number of users while simultaneously organizing it into a database-friendly format that allows staff to see connections between projects that could be opportunities for collaboration.20
Cross reference: Component 04: Performance-Based Programming, step 4.1.3
Massachusetts Department of Transportation (MassDOT)
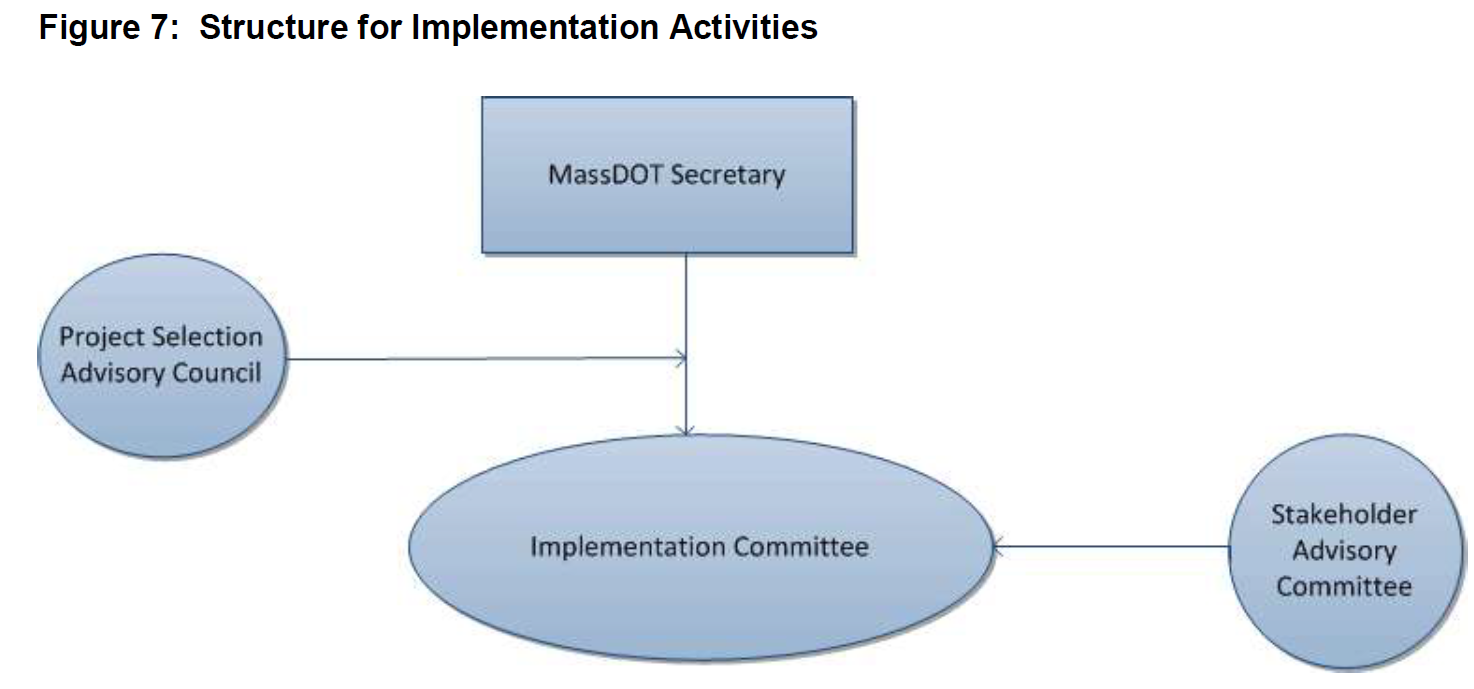
Section 11 of Chapter 46 of the Acts of 2013 established a Project Selection Advisory Council charged with developing uniform project selection criteria for cross-modal programming.21 MassDOT integrated separate transit, highways, aeronautics, and a division of motor vehicles into a fully multimodal agency; collaboration among the divisions is a critical factor for success as the agency moves toward cross-modal prioritization in programming.
Council members were appointed by the legislature, with the MassDOT Secretary as chair. Members comprised representatives from MassDOT, such as the General Manager of the Massachusetts Bay Transportation Authority (MBTA) as well as representatives from external organizations. The Council included a policy and planning expert, a transportation finance expert, an engineer, a regional planning association representative, and a municipal representative.
Over an 18-month period, the Council met regularly and consulted with the public and legislature. On July 1, 2015, “Recommendations for MassDOT Project Selection Criteria” was delivered, focusing primarily on modernization and capacity projects.
As a result of the Council’s final report, a Stakeholder Advisory Committee was created to include key external stakeholders (RTAs, MPOs, and municipalities) who would be impacted by implementation. An internal Implementation Committee was also created as a result of the Council’s final report. With assistance from the Stakeholder Advisory Committee, the Implementation Committee is responsible for developing guidance for project scoring and managing implementation of the framework as a whole within the agency.
Figure B-7: MassDOT Collaboration Structure
Source: Recommendations for MAssDOT Project Selection Criteria22
Agency Collaboration in the Washington, DC Region23
A pilot program facilitated by the American Association of State Highway and Transportation Officials (AASHTO) sought to establish methods to collaboratively identify and implement multimodal, cross-agency congestion reduction strategies with a number of agencies in the Washington, DC area:
- MD State Highway Administration
- National Capital Regional Transportation Planning Board/Metropolitan Washington Council of Governments
- Washington Metropolitan Area Transit Authority
- Maryland National Capital Park and Planning Commission
- Montgomery County
The research team facilitated discussion among the agencies to determine a six-step methodology for identifying, prioritizing, and implementing multimodal congestion strategies in a “hotspot” location. One location was selected from a larger list of bus priority hotspots compiled based on frequency and speed data as well as ridership and agency assessments. The final location was selected through discussions between agency representatives who prioritized the list from their agency’s perspective, avoiding locations where projects were already underway, and prioritizing locations where bus and auto needs aligned, and where data were available to assess the auto perspective.
The methodology established is detailed in Table B-4, and further detail about how steps were conducted is provided in Figure B-8.
Source: Performance-Based Planning and Programming Pilots24
| Step | Description/th> |
|---|---|
| 1. Collect Data | Individual agencies collect data to support evaluation of their systems. |
| 2. Identify Hotspots | Inventory data across agencies and collaborate to identify shared priorities. Use totality of data to identify a large list of multimodal hotspots and afterwards obtain input from roadway agencies. |
| 3. Identify Strategies | All agencies suggest potential strategies and provide guidance on viability and effectiveness of each. Filter projects that are not possible or appropriate for context. |
| 4. Evaluate Strategies | Come to agreement on evaluation methodology, criteria, and performance measures to use to compare and prioritize strategies. |
| 5. Select Preferred Strategy | Select preferred strategy collaboratively, based on evaluation of expected performance and costs. |
| 6. Implement Preferred Strategy | The appropriate implementing agency programs, funds, constructs, and operates the strategy. |
Figure B-8: AASHTO Collaborative Congestion Reduction Process Flowchart
Source: Performance-Based Planning and Programming Pilots25
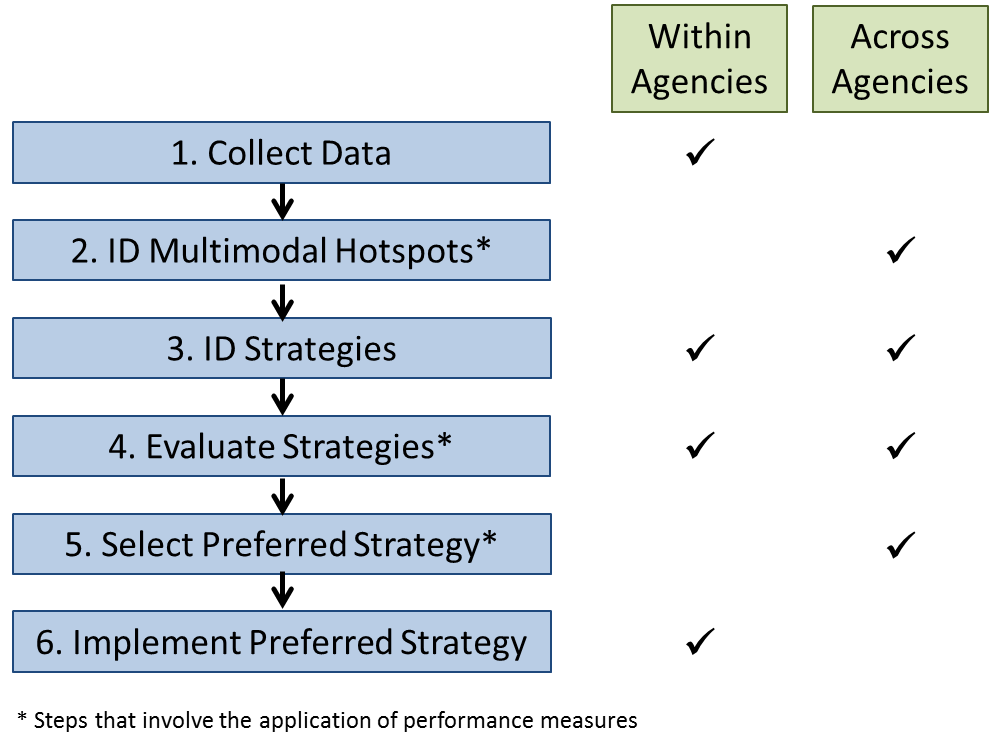
After the pilot, agency representatives were interviewed concerning challenges and potential solutions. Some of the important themes included:
- A desire to combine roadway and transit measures to develop person-based, mode-neutral measures such as delay per traveler. This would make evaluation of multimodal projects easier.
- Identification that the biggest challenge within the process is moving from step 5 to 6, when the implementing agency must follow through to program and fund selected projects. Possible solutions included 1) implementing agencies create line item programs specifically for collaboratively-identified projects, 2) agencies maintain a list of priorities and attach improvement to large, mode-specific projects as they are programmed, 3) develop communications techniques to target decision makers at implementing agencies to highlight the performance implications of preferred strategies, and 4) include key staff from implementing agencies early in the process to establish buy-in.
Linkages to Other TPM Components
B.2 Monitoring and Reporting
Steps in this subcomponent will assist agencies in external collaboration and coordination related to monitoring and reporting.
- Implement data sharing protocols
- Review and discuss content of reports to ensure consistent messaging
- Formalize process for monitoring and reporting
“Coordination between agencies can be especially helpful, given the vast amount of data being collected by different agencies… [and the need to] balance the need for frequent information updates with the need to use resources [efficiently].”
Source: FHWA, Performance Based Planning and Programming Guidebook
Step B.2.1 Implement data sharing protocols
Successful monitoring depends on data collection and usability; therefore, a fundamental aspect of external collaboration and coordination within TPM is data sharing. Data collaboration and coordination opportunities can be pursued to lower costs of existing data programs or to investigate ways of tapping into additional data sources from partner agencies to supplement what is already collected. With respect to existing data programs, a logical starting point for identifying opportunities for data collection efficiencies is a compilation of existing initiatives and their costs. This information can help the agency to target areas with substantial costs. Resiliency to severe weather incidents is becoming a prominent concern, and preparing for such events will require partnership with external agencies to obtain climate forecasts.
“It became readily apparent that different departments were collecting duplicate data sets and that working together we could invest in a data set worthy of… our goals.”
Source: Stan Burns, Utah DOT
Specific opportunities can be sought for data collaboration and coordination to make best use of available resources.
These may include:
- Consolidating data collection initiatives–for example, collection of curve and grade data for safety analysis as part of automated pavement data collection.
- Utilizing video-logs or LiDAR imagery to extract multiple data attributes.
- Designating responsibilities for updating data about highway inventory and condition as an integral part of construction project closeout and maintenance management processes–to reduce the need for complete re-collection of data.
- Establishing a data clearinghouse that facilitates sharing of data collected by multiple agencies.
- Maintaining an agency data catalog and requesting that staff check existing data availability prior to embarking on new data collection efforts.
- Establishing data sharing agreements with private sector organizations–for example, to obtain real time travel information in exchange for information about construction schedules and reported incidents.
- Collaborating with regional partners to share costs of acquiring data sets of common interest.
- Coordination of data collection across multiple jurisdictions through a regional or statewide body that sets standards and provides support for consistent data collection and reporting, and consolidates the reported data.
- Incorporating a system-wide, multimodal view by integrating data from various modal agencies or divisions.
Once appropriate strategies are identified, work will be required to negotiate agreements. Data sharing agreements need to lay out processes, roles, responsibilities, and financial arrangements (each party’s contribution–both direct and in-kind). Negotiations will typically also involve discussions to ensure that each party’s data requirements will be addressed–considering accuracy, precision, and fit with reporting and analysis timetables.
After implementing data sharing agreements, the initiatives should be continuously monitored to ensure they are fulfilling agency needs. If possible, include a reevaluation trigger or time period within the agreement.
Examples
Collaborative Monitoring: Freeway and Arterial System of Transportation (FAST)
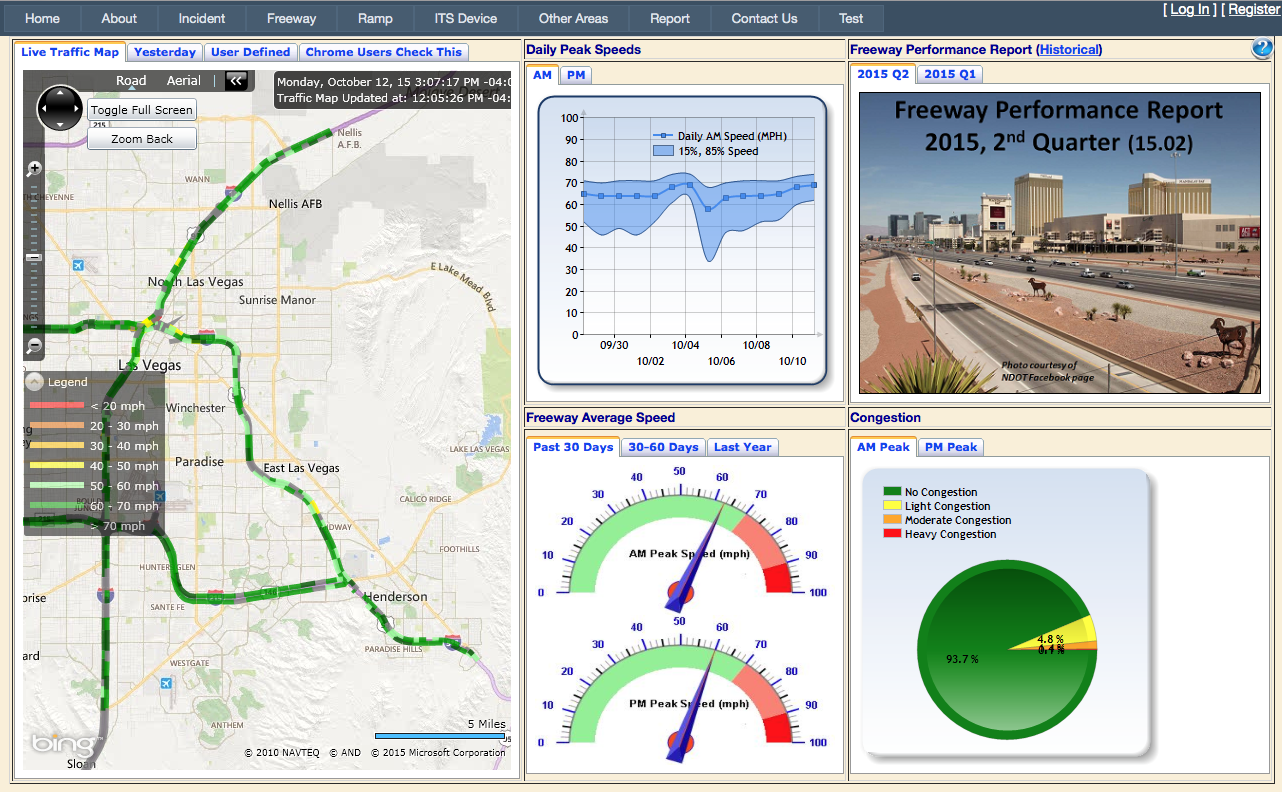
The FAST system is a comprehensive monitoring effort that develops, implements, and maintains an Intelligent Transportation System (ITS) administered by the Regional Transportation Commission (RTC) in conjunction with the Nevada Department of Transportation (NDOT). The system includes coordinated traffic monitoring cameras, signal timing, and a portfolio of projects such as ramp metering and informative signage aimed at reducing congestion and improving user experience along major corridors.
The RTC elected board develops policies for FAST, while transportation strategies are set by the Operations Management Committee (OMC), comprised of representatives from RTC, Clark County, NDOT and the cities of Henderson, Las Vegas, and North Las Vegas. RTC staff is responsible for the Arterial Management Section, which includes all arterial streets and roadways, and the Freeway Management Section, which includes the entire freeway network.26
Recent analysis of incidents on FAST revealed the impacts of large downtown conventions on the traffic patterns of Las Vegas’ major corridors. Closely examining these patterns enables RTC and partners in NDOT and the Metropolitan Police to better manage such large events and the traffic demands they entail. This includes the impact of police traffic direction, which assists by prioritizing access to and from event locations, but also contributes to corridor delays and beyond.
Figure B-9: NDOT Coordinated Traffic Monitoring Interface
Source: FAST Dashboard27
Cross reference: Component 05: Monitoring and Adjustment, step 5.2.1
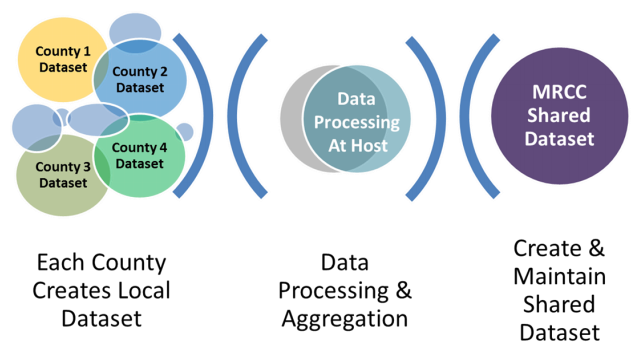
Shared Database: Metro Regional Centerline Collaborative (MRCC)28
The MRCC is a joint collaborative project involving GIS technical and managerial staff from the seven-county Minneapolis-St. Paul metropolitan area, the Metropolitan Emergency Services Board, and the Metropolitan Council, the area’s MPO. This group is facilitating the development and maintenance of an authoritative, inter-jurisdictional, publicly available road centerline data model and data set. It is doing this by having each county provide data according to specified standards.
Once completed, intended use of the data model and data set will include:
- Vehicle routing;
- Address geocoding;
- Next Generation 911 call routing and location validation;
- Emergency services dispatching;
- Linear referencing system use; and
- Cartographic road feature representation.
Figure B-10: NMRCC Data Pooling Methodology
Source: MRCC Regional Data Maintenance Project29
Cross reference: Component C: Data Management, step C.4.1
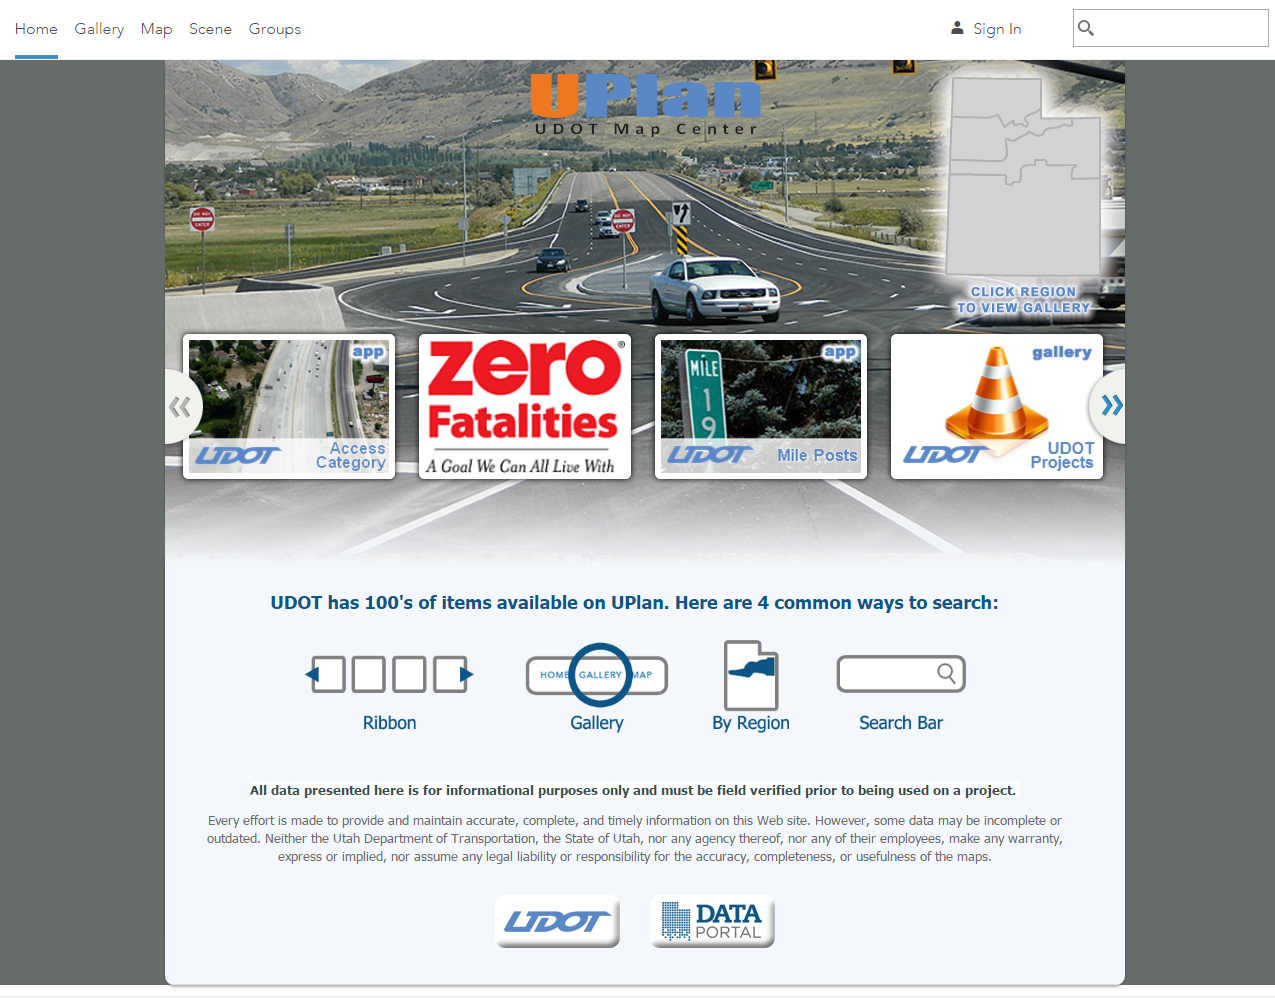
UPlan: Utah Department of Transportation:30
Utah DOT has created the UPlan interactive mapping platform to improve data sharing. UDOT can integrate any publicly-available spatial data into UPlan. Stakeholders can also share geospatial layers with UDOT, which improves collaborative decision-making by ensuring that the agency and stakeholders can view the same information (e.g., for assessing project impacts). UDOT can change access permissions, enabling it to use and share different data sources securely.
Figure B-11: UDOT Project Templates
Source: UPlan: UDOT Map Center31
Cross reference: Component C: Data Management, step C.4.1
Linkages to Other TPM Components
- Component 05: Monitoring and Adjustment
- Component C: Data Management
- Component D: Data Usability and Analysis Capabilities
Step B.2.2 Review and discuss content reports to ensure consistent messaging
Before an agency reports performance results to external audiences, staff should coordinate with partners to ensure consistent messaging across agencies. These partners at time may be part of the discussion; at other times they may be recipients of reporting. Regardless, stakeholders desire information that is easy to understand, and conflicting messages from different agencies does not fulfill that desire. Agencies must also tailor reporting to external audiences; what makes sense internally will not often translate to the public and elected officials.
In addition, reporting by one agency will impact another when targets are exceeded, attained, or missed. For example, one agency could attain a target, while another falls short of a similar target. When these agencies are within the same region, they are typically subject to similar influencing factors. Stakeholders may not understand why one target could be attained and the other missed. Partners also impact the reporting agency’s performance; these impacts should be discussed in the report. Engagement benefits the agency by potentially reducing negative attention stemming from poor performance.
While agencies could simply provide a draft for comment by partners, ideally collaboration and coordination starts earlier and is more robust. Agencies can integrate reporting, using the same schedule and the same format while still reporting individual data. Partners should collaborate to develop a communications plan that lays out presentation methods, formats, and approaches to ensure messaging is consistent, unified, and cohesive across communications products
“Measuring performance is of no value unless results are reported to the appropriate audiences in a way that makes the information readily understandable.”
Source: NCHRP Report 446: A Guidebook for Performance-Based Transportation Planning
All reports should include interpretation of results using economic indicators, weather events, and other factors, as well as what actions the agency has taken to achieve outcomes. In light of positive or negative performance, agencies should spell out next steps either to continue or correct trends to demonstrate commitment to the public and elected officials. A discussion of coordination between partner agencies can help show that resources are being used effectively and agencies are not working at cross-purposes.
Cross reference: Component 06: Reporting and Communication, step 6.2.3
Examples
Communicating Performance Website32
Hosted by AASHTO, the Communicating Performance website is a library of effective communication pieces tagged by audience, performance area, message, messenger, type, reporting period, and others elements. By applying filters, users can find example resources that can provide direction and inspiration for creation of reports.
Vital Signs Report: Coordinated Reporting Across Partners33
The Metropolitan Transportation Commission, the MPO for the San Francisco Bay Area, collaborated with the Association of Bay Area Governments to write PlanBayArea, a comprehensive housing, transportation, and land use strategy document that includes the 2040 RTP. Beyond being a logical combination of integrated issues, the work was prompted by SB 375, the California Sustainable Communities and Climate Protection Act of 2008. This required that every metropolitan area draft a Sustainable Communities Strategy to reduce greenhouse gas emissions from vehicles in part by promoting compact, mixed-use development near transit. PlanBayArea is the Bay Area’s Strategy.
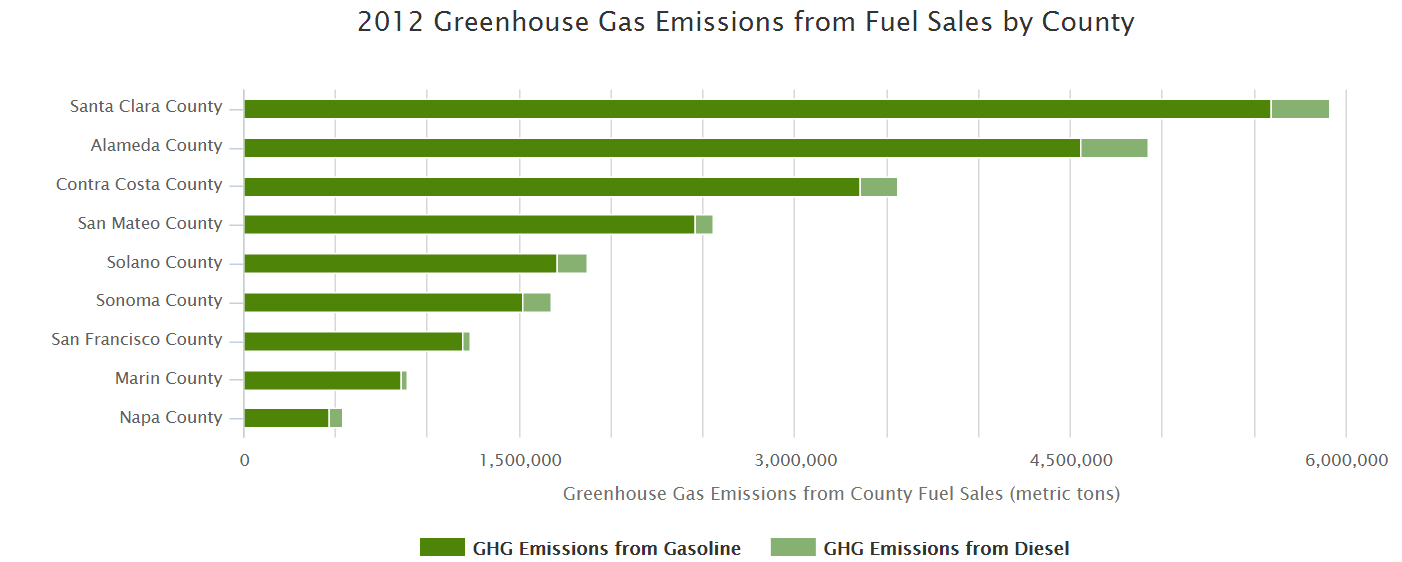
PlanBayArea contains a number of regional performance measures which are presented to the public via the Vital Signs portal, a user-friendly and interactive website. The format of the website gives the public a clear understanding of what the performance measures are, what they mean, and how they link to community concerns. It integrates measures from MTC, the Association of Bay Area Governments, the Bay Area Air Quality Management District, and the San Francisco Conservation and Development Commission, enabling external audiences a one-stop shop for these organizations’ reporting and thereby maintaining consistent messaging.
Figure B-12: Bay Area MPO 2012 Greenhouse Gas Emissions from Fuel Sales by County
Source: Vital Signs34
Cross reference: Component 06: Reporting and Communication, step 6.2.3
Incorporating Partner Agency Performance in Reporting: WSDOT
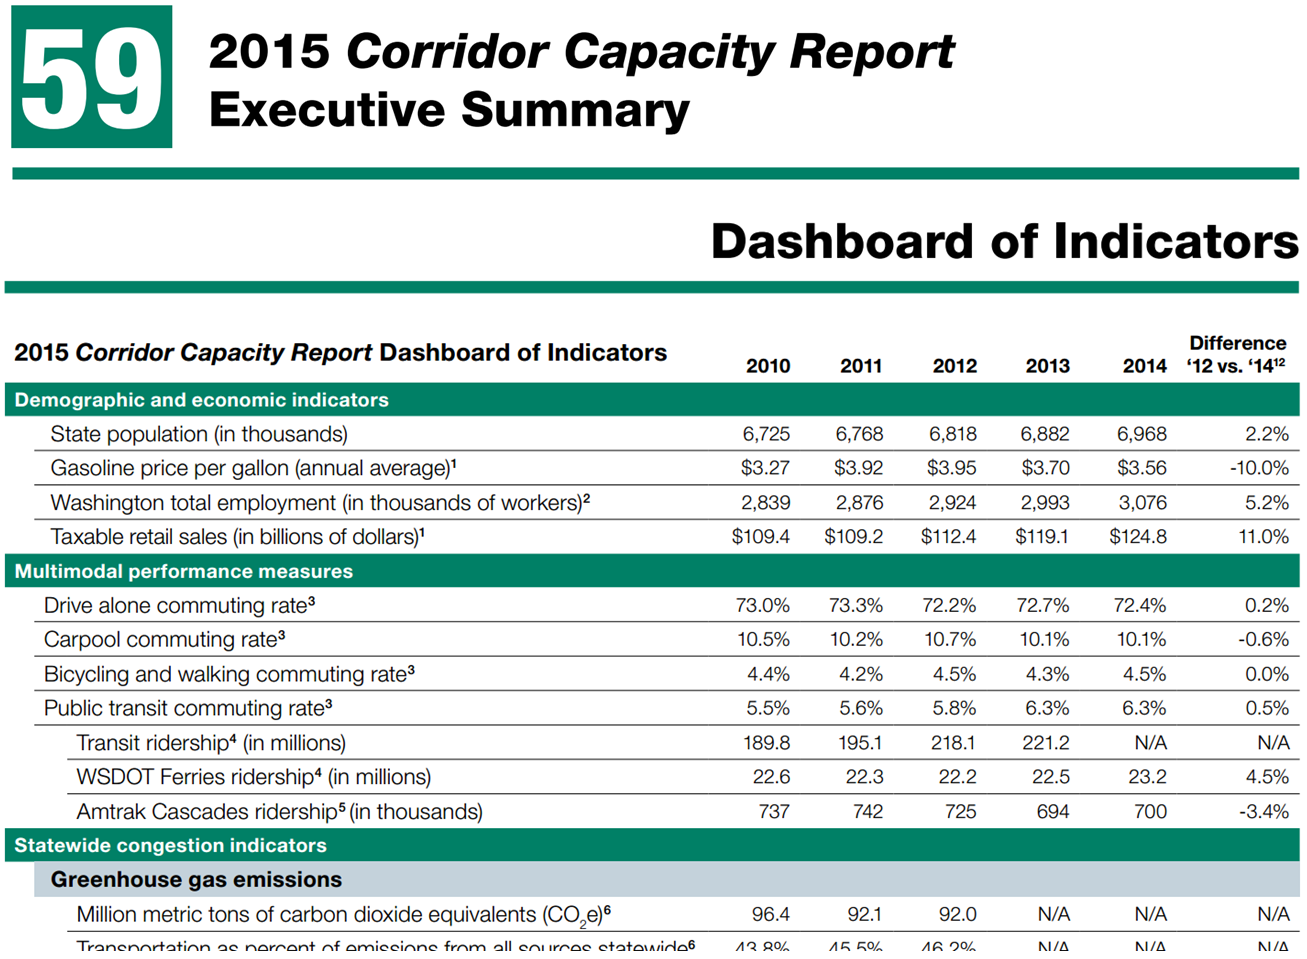
The Washington State DOT publishes The Gray Notebook, a quarterly performance report. It includes a Corridor Capacity Report that communicates not only congestion on highways, but transit and Amtrak ridership. WSDOT has taken a multimodal, holistic approach to reporting by incorporating performance data from other agencies such as Amtrak and Sound Transit and reporting a number of measures for a single commute corridor. Sound Transit and others were interested in coordinating for this report because it was a chance to tell their stories, especially because the report garners significant attention. This document is an example of multiple agencies coordinating in a single format, yet communicating individual data. At the same time, this information works well in a coordinated report and provides greater context to the performance results being reported.
Note how traditional congestion indicators are included along with multimodal performance measures and demographic/economic indicators. Often the public sees congestion as a problem, but in many cases it is an indicator of economic growth as shown in this report. By providing this contextual information, WSDOT is helping the public and partners interpret performance results.
Figure B-13: 2015 WSDOT Corridor Capacity Report
Source: Source: The Gray Notebook Volume 5935
Linkages to Other TPM Components
Step B.2.3 Formalize monitoring and reporting
Because data collection, management, and software evolve so rapidly, agencies must continually reassess their practices to identify opportunities for collaboration that could leverage partners’ capabilities. Staff should meet with partner agency staff to discuss monitoring and reporting activities to identify overlap and then develop a plan to reduce that overlap by working together.
By formally documenting the process for collaboration and coordination, agencies will hold each other accountable for the roles and responsibilities agreed to in the plan. Triggers, in terms of time period or particular event, should be included in such documentation to ensure that continuous reassessment of collaboration is undertaken.
“We’re constantly reevaluating our reports, thinking tactically, strategically, about relevance.”
Source: Daniela Bremmer, WSDOT
Once implemented, any collaborative monitoring and reporting processes should be refined when results do not meet expectations. Avoid scrapping agreements altogether if at first shared responsibility does not work; agencies are used to working separately. Ensure leadership support for collaboration to ensure it is carried through rough spots.
Examples
Data Use Agreements: I-95 Corridor Coalition
The I-95 Corridor Coalition is a partnership of transportation agencies and related organizations from Maine to Florida. The Coalition provides these agencies and organizations a forum to discuss transportation issues that cross jurisdictional boundaries.
The Coalition began its Vehicle Probe Project in 2008 to provide members with access to reliable travel time and speed data without hardware and sensors. In 2014, the organization has developed a traffic probe data marketplace to enable members to purchase INRIX, HERE, or TomTom data for their jurisdictions based on individual needs.36 The Coalition negotiated costs for all members, and once a single member purchases data, that particular data set is available to all members for no additional cost. When purchasing data, a member must complete a Data Use Agreement37 that extends the Coalition license to that member.
Data are used for incident and traffic monitoring both within and across jurisdictional borders and provides travel times for roadway signs, on websites, and for the 511 system. By collaborating and coordinating on data acquisition, the Coalition has enabled coordinated monitoring and reporting as well.
Tri-State Monitoring and Reporting: Collaboration Across State Boundaries38
The transportation agencies of Maine, New Hampshire, and Vermont have been collaboratively reporting since 2011. A memorandum of understanding was signed in 2010 stating the intention to develop common performance measures for the transportation system and agency business practices. Since that time, the state departments have published joint quarterly reports on measures including percent on-time delivery of projects, bridge condition index, and others. This common monitoring and reporting framework expanded upon coordination already taking place to share data across state lines using the Managing Assets for Transportation System, a customized software system for operations tracking and reporting. Collaboration on development and maintenance of the system has reduced costs and enabled more robust monitoring and reporting capabilities. Vermont AOT holds the contract with the vendor for the software system, but all three states are equal partners in consultation and decision-making. Often they are able, through biweekly conference calls, to manage and troubleshoot the system without relying on the vendor, significantly reducing costs. In addition to these biweekly calls, the agencies use a SharePoint site to document meetings and facilitate data sharing. Collaborative reporting on common measures has also created a framework for peer learning where staff from the three state agencies progress together.
“The close and collaborative monitoring of these measures has identified areas for improvement … and left the three states well positioned to meet the requirements [of MAP-21].”
Source: Tri-State Performance Measures: 2013 Annual Report
“Without a doubt, and with ‘no fear’, the Tri State members recognize the value in collaborating and comparing similar performance measures.”
Source: Tri-State Performance Measures: 2013 Annual Report