Component D
Data Usability and Analysis
This chapter provides assistance to transportation agencies with the Data Usability and Analysis component of Transportation Performance Management (TPM). It discusses how data usability and analysis fit within the TPM Framework, describes how this component interrelates with the other nine components, presents definitions for associated terminology, and includes an action plan exercise. Key implementation steps are the focus of the chapter. Guidebook users should take the TPM Capability Maturity Self-Assessment as a starting point for enhancing TPM activities. It is important to note that federal regulations for data usability and analysis may differ from what is included in this chapter.
Data Usability and Analysis is the existence of useful and valuable data sets and analysis capabilities available in accessible, convenient forms to support transportation performance management. While many agencies have a wealth of data, such data are often disorganized, or cannot be analyzed effectively to produce useful information to support target setting, decision making, monitoring or other TPM practices.
Introduction to Data Usability and Analysis
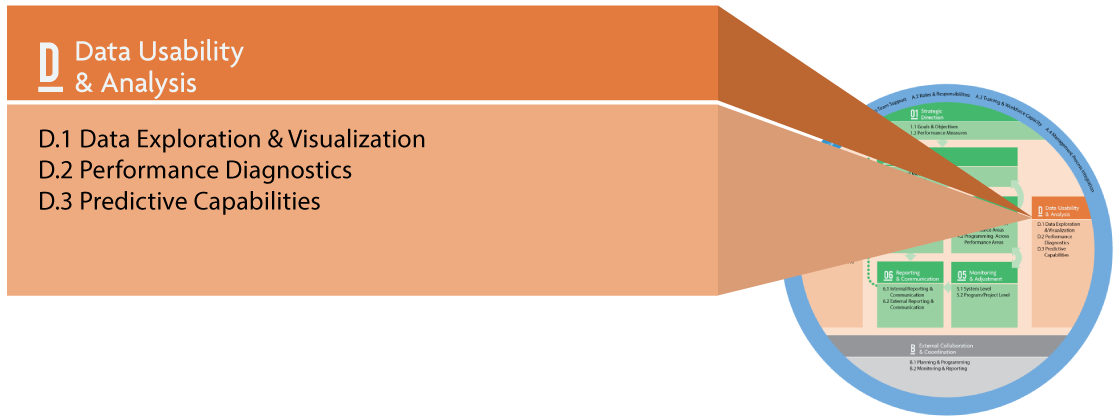
As illustrated in Figure D-1, each of the framework components depend on the existence of relevant data sets, provided in usable, convenient forms to support transportation performance management. This chapter covers steps that can be used to systematically assess data and analysis requirements, select tools, implement analysis capabilities, and develop and improve these capabilities over time.
Data usability considers the ability of a user to derive useful information from data. Data provided in a series of text files that require weeks of complex processing to be in a form suitable for analysis are not very usable. On the other hand, data delivered on a performance dashboard that can be immediately interpreted would be highly usable. Data usability is one of the key criteria included in the data value assessment process featured in NCHRP Report 814: Data to Support Transportation Agency Business Needs: A Self-Assessment Guide (see pages 38-39 and 42-43 of this reference for data usability assessment criteria and examples).
Figure D-1: Elements of Data Usability
Source: Adapted from Directions Magazine1
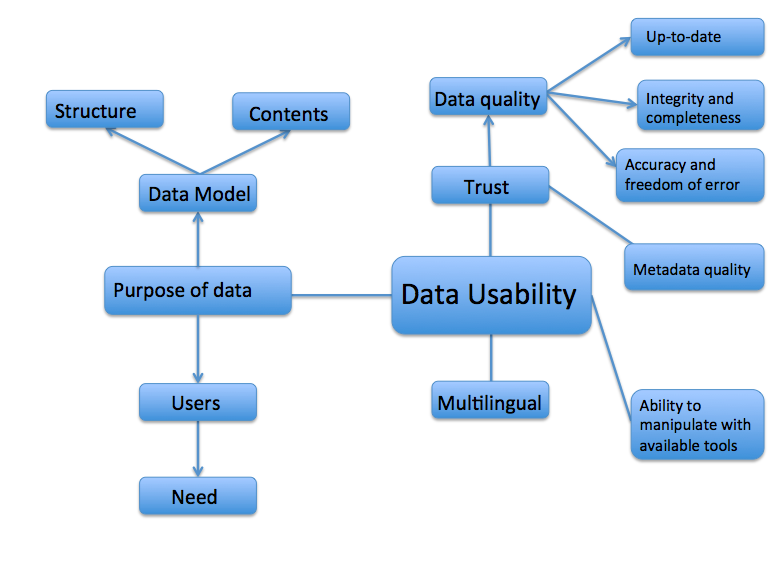
There are multiple dimensions to data usability:
- Relevance: data must address an information need
- Quality: data must be of acceptable quality for the intended purpose
- Coverage and Granularity: data must have adequate coverage and be structured at the right level of granularity
- Accessibility and Documentation: data must be accessible, with sufficient metadata for potential users to understand their derivation and meaning
- Ease of Analysis: appropriate tools must be available to manipulate the data (e.g., filtering, sorting, and aggregating) and viewing the data (e.g., mapping and charting). In some cases, specialized methodologies and tools are needed to perform statistical analysis or predictive modeling
A proactive approach to data usability can ensure that available data are put to good use for TPM. Agencies should examine not only the data and tools that are available for performance monitoring and reporting but also the backgrounds and capabilities of the staff who will be analyzing and using the data. For example:
- Do they know what questions to ask about the data?
- Do they understand the data’s level of accuracy and precision?
- Do they understand the precise definitions of the data elements?
- Are they familiar with changes that may have occurred over time in data collection methods and definitions?
- Do they understand how variations in filter conditions may impact results?
- Are they familiar with tools and techniques for presenting data in a useful way?
- Do they have access to specialized expertise in data integration, data manipulation and statistical analysis that may be required for performance trend analysis, diagnostics, and prediction?
A transportation performance management skills assessment can include these questions in order to recognize and understand potential challenges that will need to be addressed to ensure a strong transportation performance management capability. There may be a need to build staff capacity in data analysis methods through recruiting, training, and mentoring. Collaboration within the agency can be used to leverage available expertise internally. For example, staff within an agency data management unit can be tapped to provide advisory services to staff within an operations performance function. Outsourcing can be used as a strategy for gaining specialized skills and providing internal staff with exposure to new techniques. See subcomponent A.3 Training and Workforce Capacity for further discussion.
External collaboration can be pursued to help provide the necessary capabilities when partner agencies share common performance monitoring and reporting needs. In this situation, available staff resources can be pooled to take advantage of complementary skill sets across agencies. Staff roles and responsibilities can be negotiated as part of data-sharing agreements. See External Collaboration and Coordination (Component B), subcomponent B.2 Monitoring and Reporting.
Subcomponents and Implementation Steps
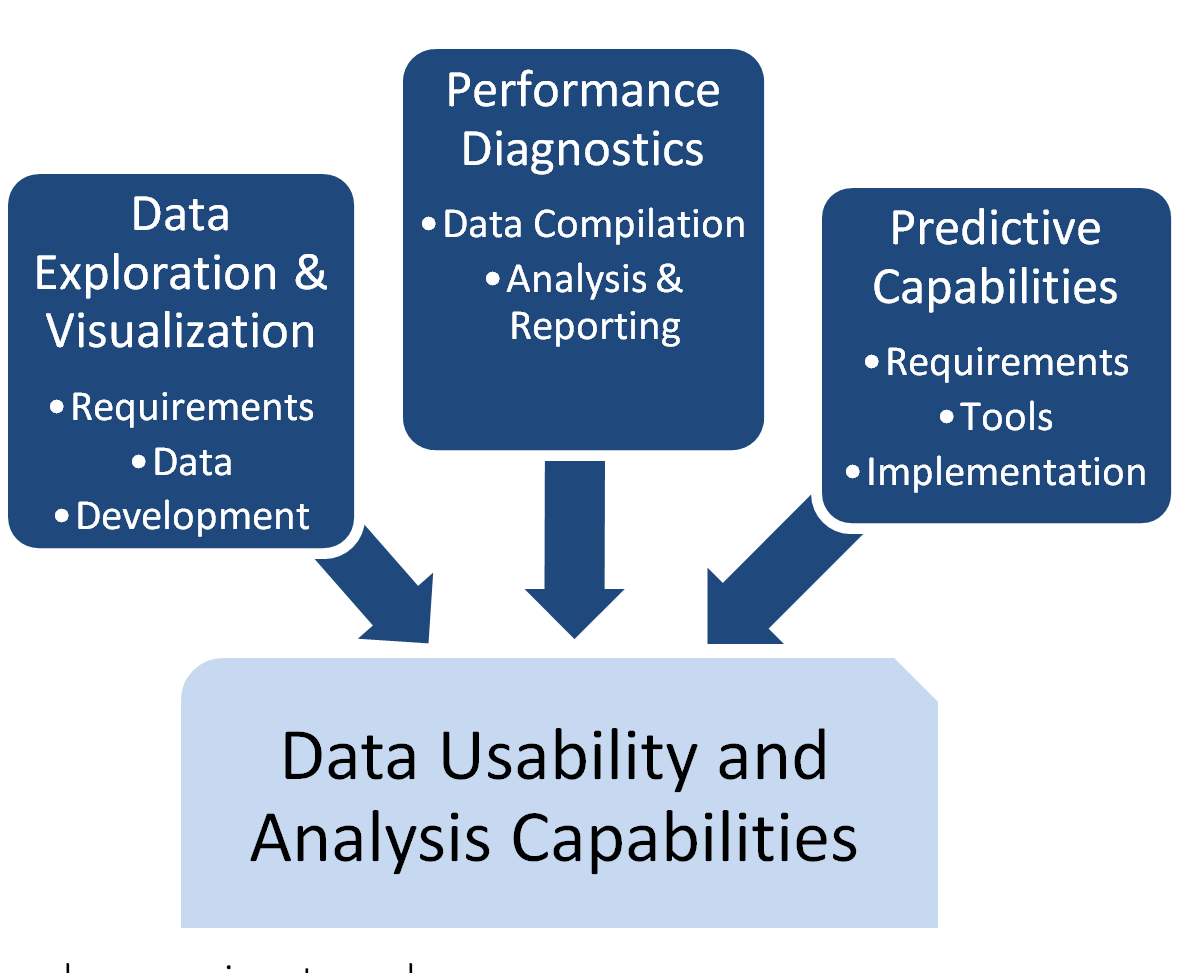
Figure D-2: Subcomponents for Data Usability and Analysis
Source: Federal Highway Administration
Usability and Analysis is defined here as: the existence of useful and valuable data sets and analysis capabilities available in accessible, convenient forms to support transportation performance management. While many agencies have a wealth of data, it may not be in the right form to allow for visualization or analysis to support target setting, decision-making, monitoring, or other TPM practices. Agency efforts to process data into convenient forms, provide useful visualization and analysis tools, and build staff capacity will directly impact an agency’s ability to understand and improve performance.
Ensuring usability of data for transportation performance management involves considering three types of capabilities (Figure D-2):
- Data Exploration and Visualization: availability and value of data, tools, and reports for understanding performance results and trends.
- Performance Diagnostics: availability and value of data, tools, and reports that allow an agency to understand how influencing factors affected performance results both at the system and project levels.
- Predictive Capabilities: availability and value of analytical capabilities to predict future performance and emerging trends.
These three capabilities are interrelated. Data exploration and visualization capabilities build a foundation for performance diagnostics by allowing agencies to explore variations in performance over time, across the network, and for other subsets of interest. Through this process, questions intuitively arise about reasons for performance variations. These questions lead to identification of additional data sets and views that could be helpful for performance diagnostics. Performance diagnostics capabilities contribute to establishment of predictive capabilities. Once causal factors behind performance results are understood, models can be created based on relationships between independent variables (such as funding levels, programmed projects, VMT, growth patterns, etc.) and performance measures of interest.
As illustrated in Table D-1, Table D-2, and Table D-3 these interrelated capabilities contribute to each of the fundamental TPM activities of target setting (Component 02), performance-based planning (Component 03), performance-based programming (Component 04), monitoring and adjustment (Component 05), and reporting and communications (Component 06). For example, the process of setting a performance target for pavement condition is facilitated by the ability to visualize and explore pavement condition trends across geographic areas, road network subsets, and pavement types. This data exploration capability could be used to inform further analysis of major contributing factors to pavement performance (i.e., performance diagnostics). The diagnostic analysis would then support predictive modeling of future pavement performance under varying assumptions.
Source: Federal Highway Administration
| TPM Component | Sample TPM Activities Requiring D.1 Exploration and Visualization Capabilities |
|---|---|
| 02. Target Setting | Visualize trends |
| 03. Performance-Based Planning | Visualize deficiencies and needs to inform strategy development Visualize impacts of alternative investment scenarios |
| 04. Performance-Based Programming | Track locations of programmed projects against deficiencies |
| 05. Monitoring and Adjustment | Understand timing of programmed project completion |
| 06. Reporting and Communication | Tailor performance reports to different audiences |
Source: Federal Highway Administration
| TPM Component | Sample TPM Activities Requiring D.2 Exploration and Visualization Capabilities |
|---|---|
| 02. Target Setting | Identify factors that have impacted performance trends |
| 03. Performance-Based Planning | Understand impacts of implemented strategies |
| 04. Performance-Based Programming | Understand program effectiveness |
| 05. Monitoring and Adjustment | Diagnose reasons for delays and take appropriate action Identify factors contributing to performance results |
| 06. Reporting and Communication | Explain reasons for performance results |
Source: Federal Highway Administration
| TPM Component | Sample TPM Activities Requiring D.3 Exploration and Visualization Capabilities |
|---|---|
| 02. Target Setting | Assess future ability to achieve targets under varying assumptions |
| 03. Performance-Based Planning | Identify strategies based on projected performance |
| 04. Performance-Based Programming | Predict impacts of programmed projects on multiple performance areas |
| 05. Monitoring and Adjustment | Adjust predictions of program outcomes based on project delivery status Update revenue projections to assess program delivery risk |
| 06. Reporting and Communication | Communicate future implications of investment decisions |
It is important to keep in mind that most agencies already have capabilities for data analysis in place. The processes defined in this guidebook can be viewed as a way to build on existing capabilities in order to strengthen the value of data for transportation performance management. Table D-4 outlines implementation steps for each of these capabilities that will be further explored in this chapter.
Source: Federal Highway Administration
| Data Exploration and Visualization | Performance Diagnostics | Predictive Capabilities/th> |
|---|---|---|
| 1. Understand requirements | 1. Compile supporting data | 1. Understand requirements |
| 2. Assess data usability | 2. Integrate diagnostics into analysis and reporting processes | 2. Identify and select tools |
| 3. Design and develop data views | 3. Implement and enhance capabilities |
Clarifying Terminology
Table D-5 presents the definitions for the data usability and analysis terms used in this Guidebook. A full list of common TPM terminology and definitions is included in Appendix C: Glossary.
Source: Federal Highway Administration
| Common Terms | Definition | Example |
|---|---|---|
| Data Exploration and Visualization | Presentation of data in a graphical form to enable interactive analysis and facilitate understanding and communication. | Common TPM data visualizations include maps showing highway links with poor performance, trend lines showing average crash rates, and dashboards showing charts with key performance indicators. |
| Data Usability | The ease with which user information needs can be met with available data, tools, and skills. | A data feed of highway travel speeds is not usable in its raw form. Data processing, summarization and presentation are required to make this data feed usable. |
| Imputation | Substitution of estimated values for missing or inconsistent data element values. | A probe data set consisting of speeds by five-minute period for each section of an Interstate may have missing data due to insufficient observations for some periods/sections. Data for these periods/sections may be imputed based on values for nearby sections. |
| Performance Diagnostics | Analysis of root causes for performance results. | Correlating traffic incidents with travel speed data; breaking down crash data by contributing factors recorded in crash records or highway inventories. |
| Transportation Performance Management | A strategic approach that uses system information to make investment and policy decisions to achieve performance goals. | Determining what results are to be pursued and using information from past performance levels and forecasted conditions to guide investments. |
Relationship to TPM Components
The ten TPM components are interconnected and often interdependent. Table D-6 summarizes how each of the nine other components relate to the data usability and analysis component.
Source: Federal Highway Administration
| Component | Summary Definition | Relationship to Performance-Based Planning |
|---|---|---|
| 01. Strategic Direction | The establishment of an agency’s focus through well-defined goals/objectives and a set of aligned performance measures. | Establishing performance measures that can realistically be tracked requires consideration of data and analysis requirements. |
| 02. Target Setting | The use of baseline data, information on possible strategies, resource constraints, and forecasting tools to collaboratively set targets. | Establishing performance targets requires analysis and interpretation of available trend data, as well as capabilities for predicting future performance under varying assumptions. |
| 03. Performance-Based Planning | Use of a strategic direction to drive development and documentation of agency strategies and priorities in the long-range transportation plan and other plans. | Data usability and analysis support evaluation of alternative mid and long-range scenarios. |
| 04. Performance-Based Programming | Allocation of resources to projects to achieve strategic goals, objectives and performance targets. Clear linkages established between investments made and their expected performance outputs and outcomes. | Performance-based programming requires application of analysis capabilities for evaluation of the performance outcomes of candidate projects for programming. |
| 05. Monitoring and Adjustment | Processes to monitor and assess actions taken and outcomes achieved. Establishes a feedback loop to adjust programming, planning, and benchmarking/ decisions. Provides key insight into the efficacy of investments. | Data usability and analysis are integral to performance monitoring–they are needed to support the process of understanding patterns, identifying key performance drivers, and pinpointing areas for improvement. |
| 06. Reporting and Communication | Products, techniques, and processes to communicate performance information to different audiences for maximum impact. | Data visualization capabilities are essential for effective communication of performance information to different audiences. |
| A. TPM Organization and Culture | Institutionalization of a TPM culture within the organization, as evidenced by leadership support, employee buy-in, and embedded organizational structures and processes that support TPM. | Data visualization capabilities enable a shared picture of performance that supports an agency performance culture. |
| B. External Collaboration and Coordination | Established processes to collaborate and coordinate with agency partners and stakeholders on planning/ visioning, target setting, programming, data sharing, and reporting. | Data visualization capabilities enable a shared picture of performance that supports external collaboration. |
| C. Data Management | Established processes to ensure data quality and accessibility, and to maximize efficiency of data acquisition and integration for TPM. | Data management practices are essential for strengthening data usability for TPM. |