Component 02
Target Setting
Implementation Steps
2.1 Technical Methodology
The technical methodology will provide an agency with target options to consider. The following section outlines steps agencies can follow to implement a sustainable technical methodology to target setting.
- Establish a baseline
- Analyze historical trends
- Identify influencing factors and assess risk (internal and external)
- Define target parameters
- Forecast future performance
- Document technical methodology
“Target setting is difficult for many reasons, including limitations in data and tools to forecast expected performance levels, uncertainties due to exogenous factors that may affect performance, concerns about setting targets that are either too ambitious or too modest, and public and elected officials’ perceptions, among other issues.”
Source: Target Setting Peer Exchange (2014)
Step 2.1.1 Establish a baseline
The most important first step in the target setting process is to assemble data to develop a baseline for the performance measures established in the Strategic Direction (Component 01). The baseline illustrates past performance, and serves as a jumping off point from which implementation and progress begins. Developing a baseline means digging into what data the agency has available and how it is organized. For new measures, agencies may be limited to a single baseline value for one point in time, which provides a starting point from which a trend line can be created. As this quote from the Safety Target Setting Final Report illustrates, a chosen performance measure may determine the approach for determining the baseline:
The first consideration when setting a target is what will be used for a base-year value against which the target will be compared. According to Traffic Safety Performance Measures for States and Federal Agencies, a three- or five-year rolling average is recommended. Rolling averages show long-term trends more clearly than annual counts. The longer the time period for which the average is used, however, the longer it will take for trends to show up in the data. If a multiyear average is used, a State or region also will likely track annual numbers.2
The baseline will also be critical to informing performance forecasts. Activities involved in establishing a baseline are:
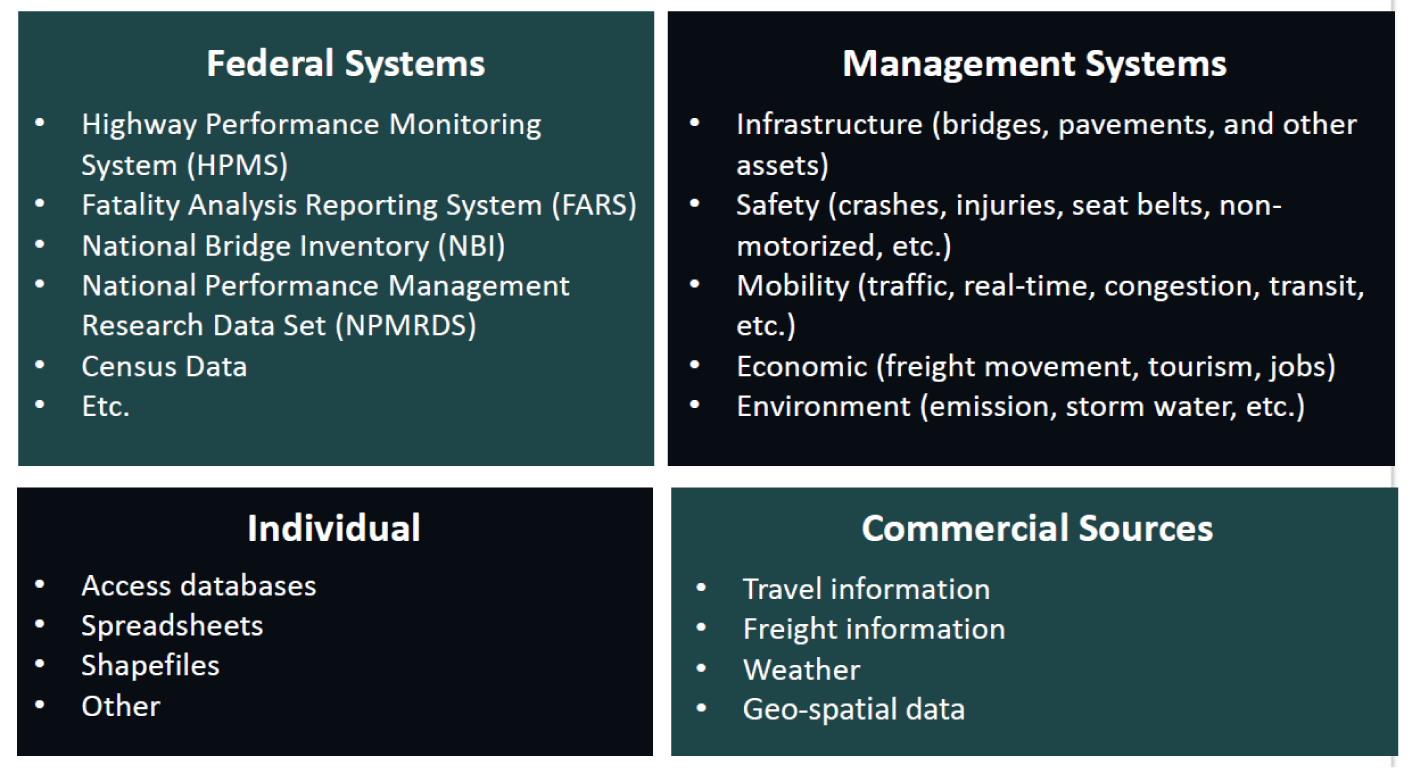
- Determine data source, ownership, and when updated
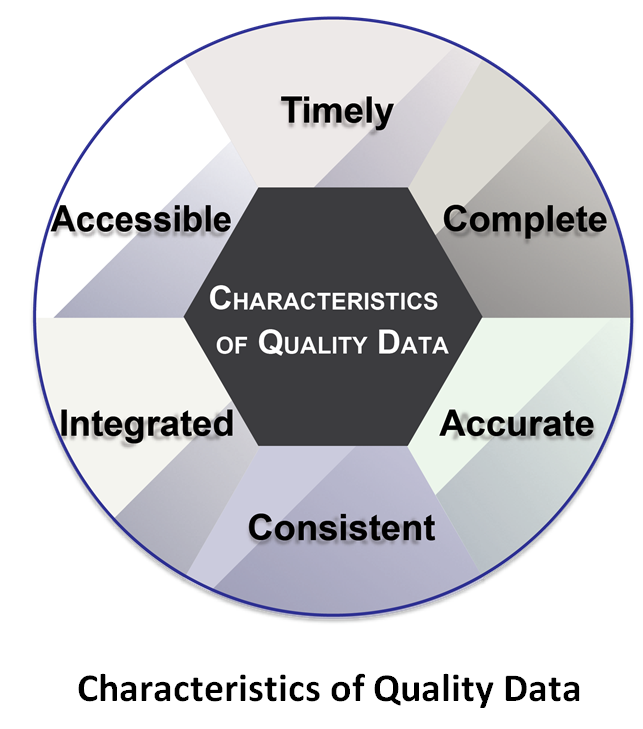
- Assess data quality
- Identify data gaps
- Formulate strategies to close data gaps, if cost-effective
- Use agreed-upon data to establish baseline
Figure 2-2: Characteristics of Quality Data
Source: Federal Highway Administration
Examples
Figure 2-3: Example Data Sources to Support Establishment of a Baseline
Source: Federal Highway Administration
Linkages to Other TPM Components
- Component 01: Strategic Direction
- Component C: Data Management
- Component D: Data Usability and Analysis
Step 2.1.2 Analyze historical trends
This step involves examining and analyzing the trend data that has been assembled in order to try and understand reasons for observed variations. The purpose of this step is look to the past for clues as to where the agency is going. Understanding past results can provide direction for setting future targets; why did the agency get the observed performance results?
Specific activities include:
- Confirm that measure calculations are consistent and comparable over time
- Identify repeating patterns and correlate them with other external trends (e.g., economic upturn and higher congestion)
- Investigate atypical variations in trend (e.g., severe winter weather)
- Locate “shifts” in the trend line due to policy changes (e.g., lifting of motorcycle helmet law)
Examples
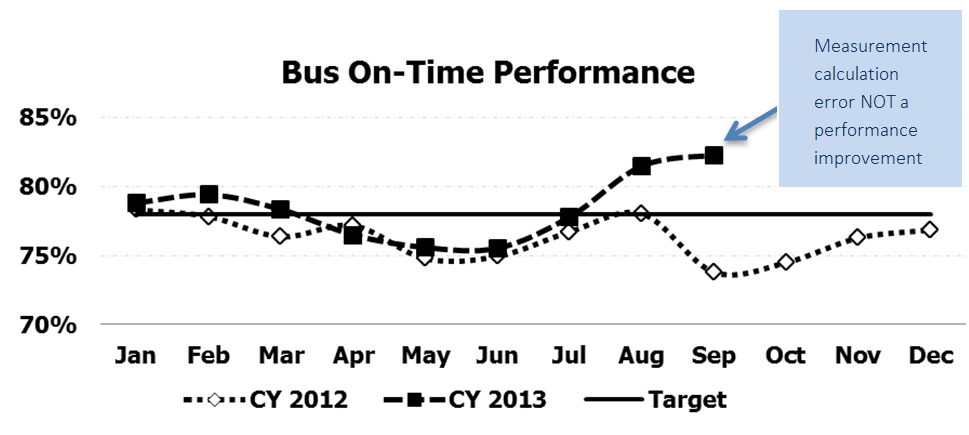
The importance of confirming that performance measure calculations are consistent and comparable over time was demonstrated at the Washington Metropolitan Area Transportation Authority (WMATA). In December 2013, WMATA reported to their Board of Directors that bus on-time performance had improved to over 80%, a historically un-chronicled level. Unfortunately, WMATA had to retract this statement when staff discovered that this result was due to new fleet technology failing to capture all the buses arriving early, thus compromising Bus On-Time Performance results for the latter portion of CY2013.
Figure 2-4: Bus On-Time Performance Calculation Error
Source: Adapted from WMATA Vital Signs Report3
Linkages to Other TPM Components
Step 2.1.3 Identify influencing factors and assess risk (internal and external)
In order to understand past and future performance, it is essential to assess risk by identifying both internal and external influencing factors. Internal factors include issues within an organization that can potentially be addressed over time, since they are under the control of the agency, and in some cases may even be leveraged to ensure that the target is met. External factors, by contrast, are outside agency control, but still affect performance outcomes. The identification of internal and external factors is linked to the “analyze historical trends” step where the following question was asked, “why did performance change”? The answer to this question will undoubtedly uncover several factors that will continue to affect performance results. For example, the economy has a major influence on transportation performance. When the economy is strong, the roads are more congested, the pavements deteriorate due to greater truck traffic on highways, and freight flow increases. When population in a region increases, so do transportation demands. The recent oil boom in several states has resulted in changing traffic volumes and patterns in a manner that has been difficult to predict.
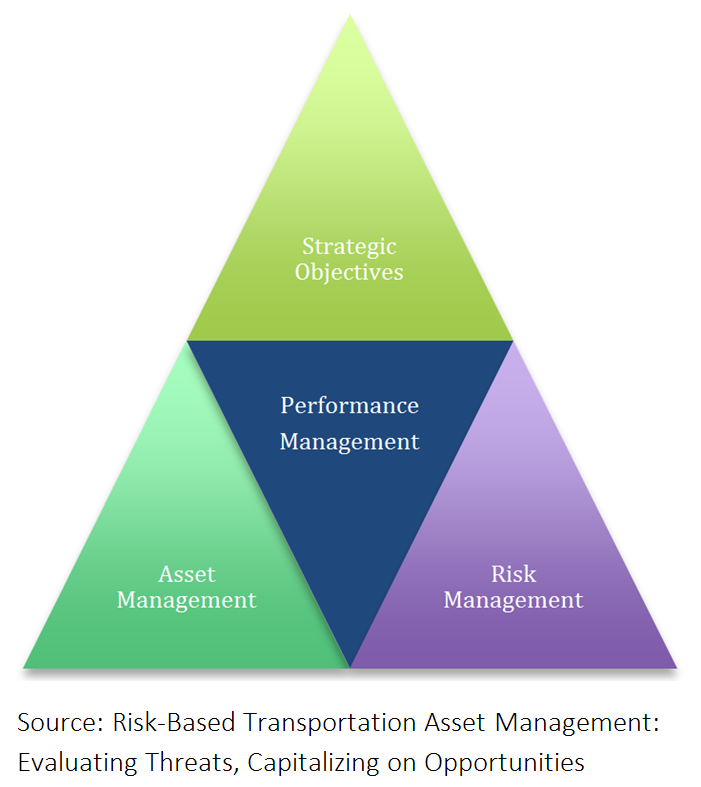
Figure 2-5: Identification of Factors Related to Performance Outcomes
Source: Risk-Based Transportation Asset Management: Evaluating Threats, Capitalizing on Opportunities4
Both internal and external factors must be acknowledged in order to fully understand the context of the target, to anticipate any impacts on performance, and to begin addressing these issues as part of the TPM business approach.
In short, understanding influencing factors helps understand limitations. With a better understanding of the performance situation, targets can be more accurate and in turn more helpful. Table 2-4 contains a list of internal and external factors to consider in target setting.
Source: Federal Highway Administration
| Internal | External |
|---|---|
| Funding | Economy |
| Staffing constraints | Weather |
| Data availability and quality | Politics/Legislative requirements |
| Leadership | Population growth |
| Capital project commitments | Demographic shifts |
| Cultural barriers | Zones of disadvantaged populations |
| Agency priorities | Vehicle characteristics |
| Agency jurisdiction | Model shares |
| Senior management directives | Gas prices |
| Policy directives (e.g., zero fatalities) | Land use characteristics |
| Cross performance area tradeoffs | Driver behavior |
| Collaboration across agency | Traffic |
In addition to building a comprehensive list of all potential factors that might influence performance results and subsequently the target, agencies should also make an assessment of two items: 1) which factors will likely have the largest effect on performance results and 2) which factors the agency can influence or control. However, quantification (to the extent possible and practical) of the effect these factors have on results could be postponed until the “forecasting future performance” implementation step. As agencies complete additional cycles of target setting, the ability to identify and understand the effect of various internal and external factors will increase.
Assessing the risk of internal and external influencing factors is a widely accepted method of understanding how such factors might influence a performance target and identifying approaches to mitigate their impact. Risk refers to the positive or negative effects of uncertainty or variability of any threat to achieving strategies, goals, and targets. Given that performance-based planning focuses on future outcomes, the inclusion of risk in the development of strategies and investment prioritization is important. Assessing and managing risk means determining the likelihood of such a threat occurring, as well as understanding and planning for the associated impacts. This is a key consideration in any planning effort, as part of those plans must address impacts that could cause them to derail. Risks may be positive or negative and generally can be defined as hazard, financial, operational, or strategic risks as summarized in Table 2-5.5 Scenario planning can be an effective tool in assessing risk, among others. Risk is discussed at length in NCHRP 806: Guide to Cross-Asset Resource Allocation and the Impact on Transportation System Performance (2015) and FHWA’s Risk-Based Transportation Asset Management: Evaluating Threats, Capitalizing on Opportunities (2012).
Source: NCHRP 8066
| Risk Type | Definition | Management |
|---|---|---|
| Hazard | The risk of uncertain performance due to condition and/or age of infrastructure or vulnerability to extreme events. | Addressed via contingency funding, specific strategies regarding improving condition, or reducing vulnerability to weather events. These may include prioritizing projects to achieve state of good repair (SGR), simulating deterioration probabilities, and constraining project list to the most critical. |
| Financial | The risk of a financial shift, such as a cut in revenues or a change in project cost. | Addressed via revenue source and trade-off understanding and simulation of various investment levels. |
| Operational | The risk that a prediction or strategy is incorrectly calibrated, leading to issues such as inaccurate forecasts or a lack of intended impact. | Addressed by a good feedback loop and review of forecasting abilities. |
| Strategic | The risk that management or specific programs have unforeseen weaknesses impacting the achievement of their intended purpose. | Addressed by understanding the sensitivity of performance preferences, targets, and resource allocation strategies. Strategy options may include silo versus integrated management, fixed versus flexible budget allocation, and worst first versus proactive preservation. |
To guide the risk assessment and management piece of performance-based planning, consider the steps outlined as an International Organization for Standards standard (ISO 31000)7 and used by the FHWA Risk-Based Transportation Asset Management guide. This can be a formal or informal process.
- Establish the context: Understand the social, legislative, economic, and environmental factors that may impact the agency or a particular goal, strategy, or target. This is analogous to the factor assessment that takes place for target setting.
- Identify risk: Determine which type of risk is possible out of the options above.
- Analyze risk: Understand the probability of the risk and its impact. This can be a basic understanding or rating, or it can be modeled for a more specific analysis.
- Evaluate risk: Understand the sensitivity of the agency the risk impacts; understand the severity of the impacts that the risk may cause.
- Manage risk: “Treat, tolerate, terminate, transfer, or take advantage of the risk.”8 In the context of performance-based planning, this means incorporating these steps into the planning process and developing strategies with an understanding of the risks, moving forward into the programming stage with flexibility to accommodate the kind of risks described above.
Items to keep in mind as an agency assesses and develops plans to mitigate risks associated with influencing factors include:
- Identifying potential internal and external influencing factors
- Categorizing factors by the extent of control an agency has over the results (e.g., “extensive,” “moderate,” or “limited” control)
- Assessing potential factors by the degree of on performance results
- Determining which factors should be considered in the current target setting effort
- Revisiting, periodically, the list of influencing factors to drop or add factors, or to change assessment of agency control and/or degree of influence
Examples
Degree of Influence over Risk Factors: Virginia Performs
The degree of influence an agency has over factors that affect performance outcomes will vary by factor. “Virginia Performs” is an on-line, publicly available tracker of the state’s progress toward seven strategic goals. It includes an assessment of whether the state has “significant” or “limited” control of the results. For example, Virginia determined it has “limited” control over land use related factors such as population density and land development patterns. See more here.
Internal Factors Assessed for Risk: Escalator Availability
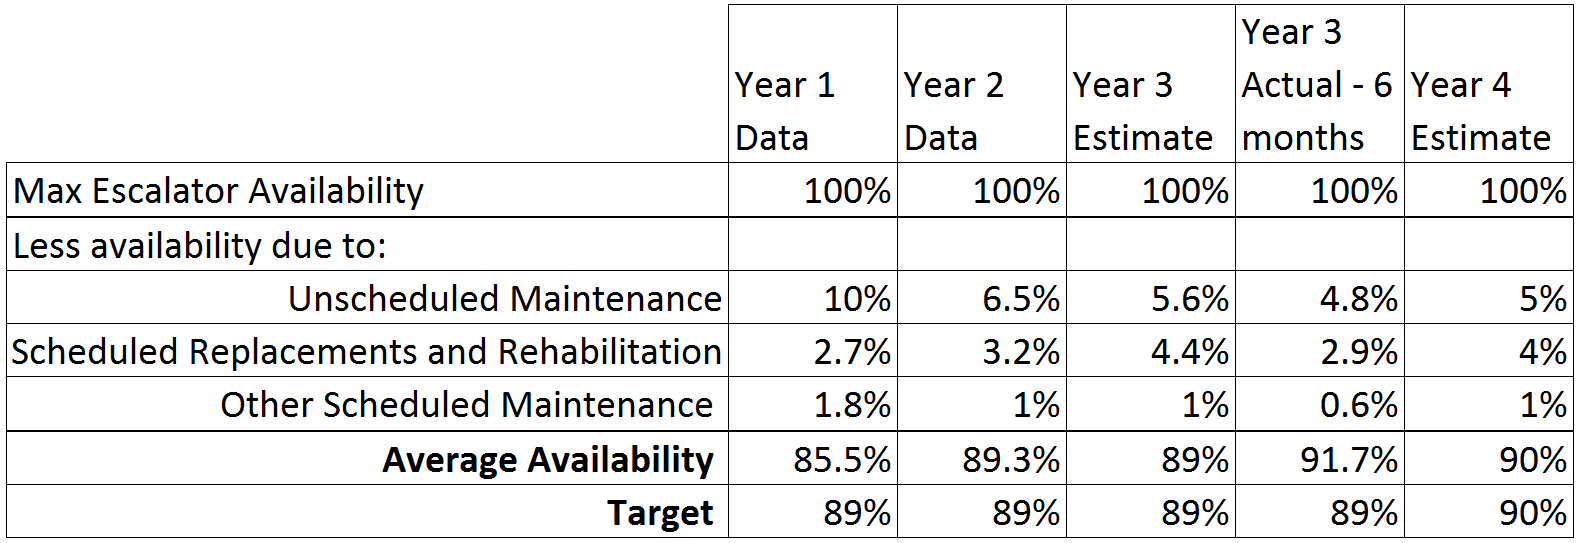
Escalator availability at a transit agency is at least partly within the agency’s direct control. From the customer perspective, an out-of-service escalator is an inconvenience and negatively affects travel time and the overall experience of traveling by transit. Customers do not distinguish between an escalator being unavailable due to scheduled maintenance or due to an unforeseen issue (e.g., damage to handrail). Therefore, some transit agencies elect to include all escalator downtime in measuring the percentage of time units are available. In this case, when setting an escalator availability target, it is vital to include the hours necessary to conduct required inspections, preventive maintenance, and modernization activities that must be conducted during operating hours. Table 2-6 and the formula below (Equation 2-1) demonstrate that given required maintenance activities, the BEST availability is 95%:
Source: Federal Highway Administration
Looking at past performance trends, some unscheduled maintenance will likely occur and should be reflected in the final availability target. Granted, efforts can be made to improve the speed and quality of both scheduled and unscheduled maintenance activities, but laying out the effect of planned capital activities in an easy to digest manner can greatly assist the target setting discussion.
Table 2-6: Impact of Scheduled and Unscheduled Maintenance on Escalator Availability
Source: Adapted from WMATA9
Linkages to Other TPM Components
- Component 03: Performance-Based Planning
- Component B: External Collaboration and Coordination
- Component C: Data Management
- Component D: Data Usability and Analysis
Step 2.1.4 Define target parameters
Targets can take on many different formats (e.g., percentage, directional, average value), different time horizons (e.g., daily to 10 year targets), and different scopes (e.g., regional, statewide, urban/rural). A key step in the technical methodology for target setting is determining these parameters. For example, in many cases, it may take a number of years for a significant investment to produce noticeable improvements in performance; annual targets may create a sense that progress is not occurring, or when it is occurring on a different time frame. In addition, the target parameters should reflect the purpose of the target (see subcomponent 2.2 Business Process). For example, agencies may elect to establish a set of targets with different time horizons to fill different needs (e.g., long-range to clarify desired policy objectives, mid-range to support management documents like Transportation Asset Management Plans, and short-range to guide annual budgetary decisions).
Items to keep in mind as target parameters are being evaluated:
- What will resonate with the target audience?
- What parameters capture changes in performance results?
- Consider the cost of data collection and presentation (e.g., more frequent may equate to more costly)
- Reflect federal, state, and/or local reporting requirements (e.g., NHS bridges)
Examples
Target Format: How the change in performance is portrayed. Below is a list of the ways to communicate a target:
- Number: The target is aiming for a specific number. Example: Achieve 300 or fewer crashes on state roadways this year.
- Directional:The target is aiming for an increase or a decrease within a measure. Example: Reduce the number of crashes on state roadways annually.
- Percentage or Rate: The target aims for a certain percent decrease or to impact a certain number of users. Example: Achieve a 20% decrease in number of crashes over the next 5 years. Or: Achieve a rate of 1 in 5 roadway users employing electronic tolling.
- Absolute:The target can be “none” or “all.” Example: Implement safety measures on all roadways.
- Tiered Targets:Targets incorporating by their definition a range of outcomes, allowing flexibility in accommodating various expected risk of influencing factors.
Geography/scope: Boundaries and filters applied to the area where performance is observed to set the extent of the target. Consider whether the scope is urban, rural, regional, corridor, one or several modes, NHS/non-NHS, etc. Keep in mind that this part of the scope is directly tied to the external factors discussed above, and that a wider geographic scope likely means more external factors to consider. The scope must resist overextending beyond the realm of responsibility.
Some considerations include:
- Area of influence: Can the decisions you make impact the scope you set?
- Federal and State requirements may determine scope.
- What is the interest of external stakeholders?
- Does the definition of scope encourage friendly competition (e.g., across districts) or lead to incorrect conclusions?
- Can related scopes that you set be aggregated? (E.g., because interstate and non-interstate NHS subsets of the NHS, they cannot be aggregated)
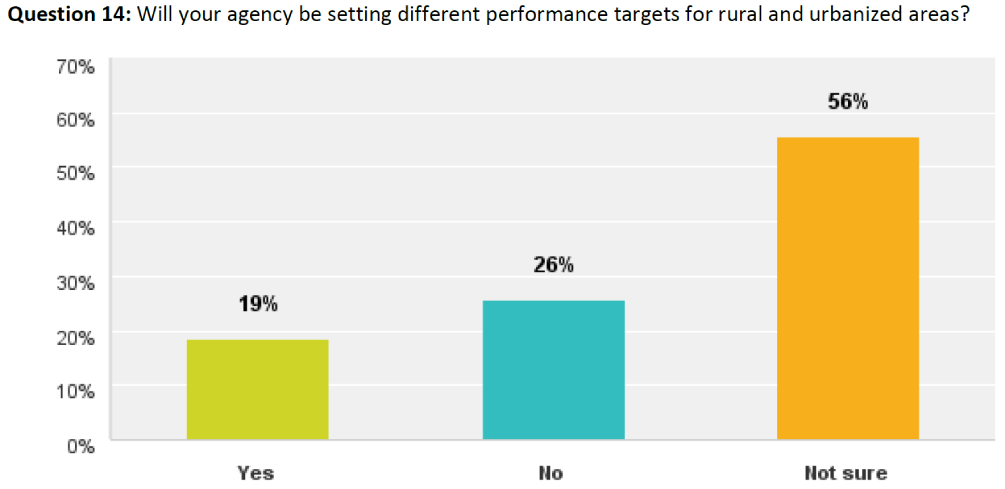
Prior to a 2014 peer exchange, State DOTs were asked if they planned to set different performance targets for rural non-urbanized and urbanized areas – or for two different scopes. The majority of the respondents indicated that they were “not sure.”10 For the agencies that indicated they would set different targets, the reasons given included different acceptable thresholds for urbanized versus rural non-urbanized delay and different infrastructure condition needs by roadway type.
Figure 2-6: State DOT Stated Desire for Setting Urbanized and Non-Urbanized Targets
Source: Target Setting Peer Exchange: Summary Report11
Time Horizon: Duration of time that will be the basis for reaching the target. This parameter should be carefully considered and chosen as is appropriate to the type of target and the feasibility of attaining a specific outcome.
Source: Federal Highway Administration
| Type | Short Range | Mid-Range | Long Range |
|---|---|---|---|
| Years | Weekly, Monthly, Annual to <5 years | >5 years; ≤10 years | >10 |
| Usage | Business Plans | Asset Management Plans | Long Range Transportation Plans |
| Most useful for | Areas where agency has more direct control (e.g., asset condition) | Areas where change occurs very slowly or a long lag time between investments and results |
Note: the frequency of reporting performance results is different than the target time horizon. For example, an agency may have an annual target for bus on-time performance but the performance data are assessed daily.
Federal regulations allow agencies to set their individual targets and determine whether to set separate targets for urban v. rural areas under an agency’s jurisdiction. However, federal target format and horizon will be set via rulemaking.
Linkages to Other TPM Components
- Component 01: Strategic Direction
- Component C: Data Management
- Component D: Data Usability and Analysis
Step 2.1.5 Forecast future performance
The purpose of this step is to identify a range of potential performance target options that may lead to a particular performance outcome. These options also feed into the target setting business process (subcomponent 2.2), the Performance-Based Planning (Component 03), and Performance-Based Programming (Component 04) processes. Given that targets specify a desired level of future performance, it is preferable (though often challenging) to develop forecasts of future performance to understand what is feasible to achieve. As discussed in Step 2.1.3, forecasting future performance should attempt to account for both internal and external factors that will affect results. A range of tools, models and methods are available to predict future performance.
Activities for development of forecasts include:
- Document assumptions
- List what factors are considered in forecasts
- Develop future scenarios based on different funding levels
“Agencies will need to calculate a baseline of performance and forecast expected performance based on that baseline in order to set targets. For many agencies, this will require an understanding of tools that do not currently exist.”
Source: AASHTO SCOPM Target Setting Peer Exchange (2014)
Examples
Below are examples of analytical tools and methods that agencies have used to forecast and communicate performance results, which can then be used to support the identification of specific targets.12
Bridge
- Bridge Management software (BrM), formerly Pontis
- Deterioration models to predict future bridge condition based on past data and bridge age
- Algorithms to process National Bridge Inventory (NBI) and Element data to establish targets
- Forecasting tool that combines historic performance and historical funding level then predicts expected condition using expected funding target for the bridge program
- Full life cycle (75 year) analysis of bridge condition combined with revenue projections and construction inflations used to maximize the investment’s impact on bridge assets
- A deficit report based upon current investment and condition compared with future investment
Pavement
- Pavement Management System (PMS): model future pavement conditions on a set of criteria such as traffic levels, asset type, age of pavement, and resource constraints
- GIS for data analysis and visualization
- Business Intelligence and visualization tools
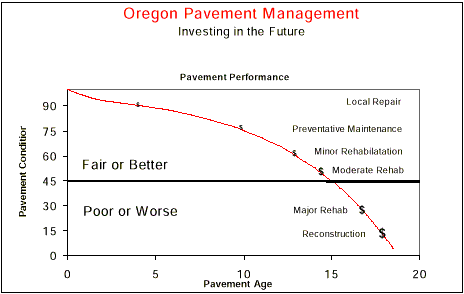
- The graph in Figure 2-7 below predicts pavement performance as it ages, indicating how costs will increase if maintenance is deferred
Figure 2-7: Pavement Performance Related to Age and Investment Practices
Source: 2012 Pavement Condition Report13
Safety
- Linear regression, rolling averages, best-fit regression analysis, non-linear regression, time-series analysis
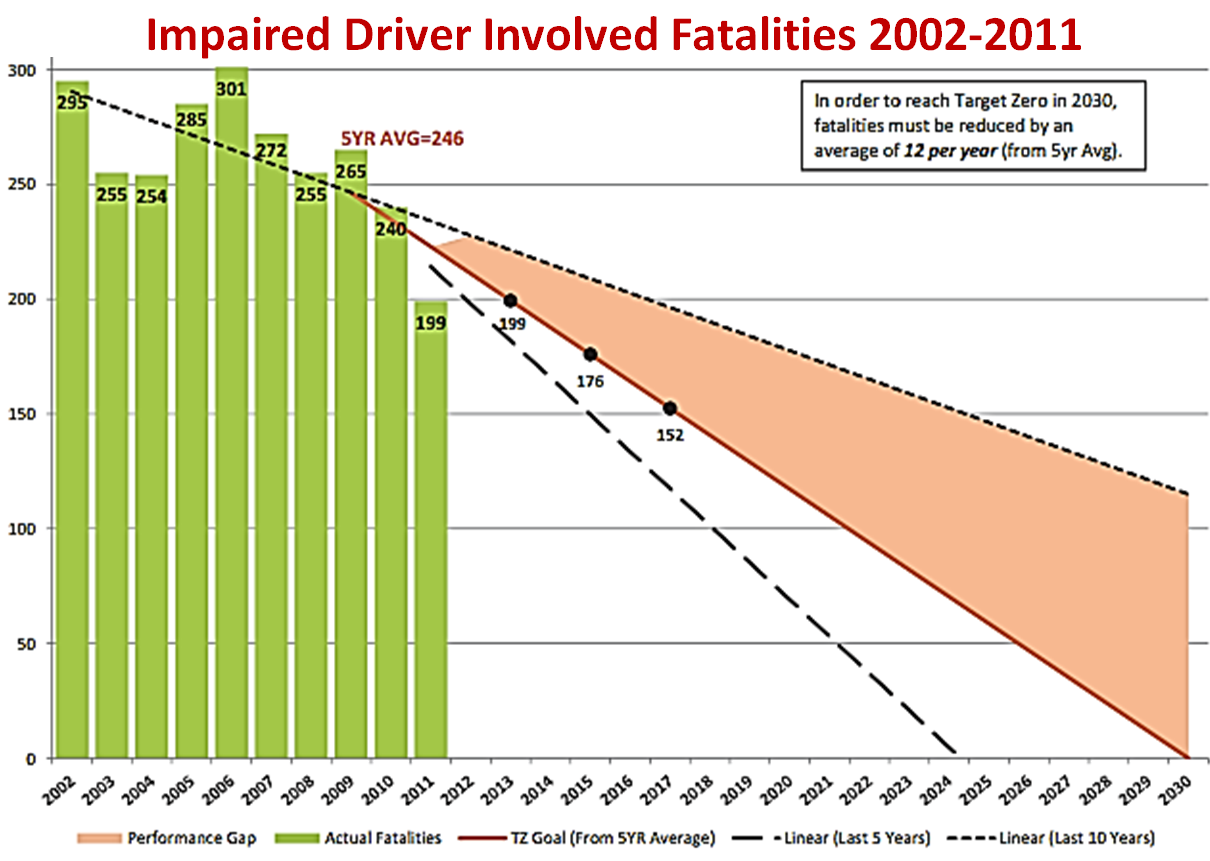
- An example of a safety trend line is provided below Figure 2-8, which shows that a reduction of 12 fatalities per year would be required in order to achieve the target within the specified time frame. The pink area inside the “tail” shows the range of values that might be achieved. This type of display is helpful for visualizing changes in performance over time. The trend line uses both five- and 10-year rolling averages and targets are projected from the five-year rolling average baseline.
Figure 2-8: WSDOT Fatality Forecasting through 2030
Source: Washington State Strategic Highway Safety Plan 2013: Priority Level One, Impaired Driver Involved14
System Performance
- Travel demand models
- Highway Capacity Manual
- System transportation performance management systems
- Model estimating the economic benefits infrastructure improvements (e.g., Highway Economic Requirement System (HERS), Transportation Economic Development Impact System (TREDIS))
- National Emissions Inventory (NEI), Air Quality System (AQS) and Mobile 6.2
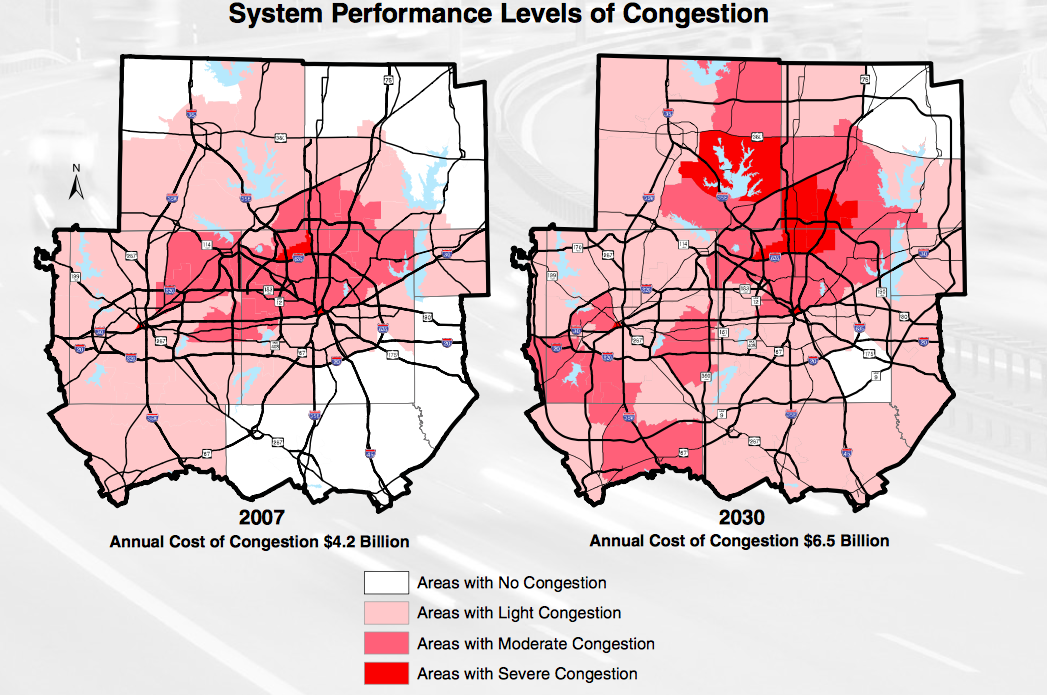
Figure 2-9 below depicts the future levels of congestion the North Central Texas Council of Governments (NCTCOG), the MPO for the Dallas Fort Worth area, forecasted using its travel demand model. It is important to note that the predicted rise in congestion is based on the assumption that all the strategies outlined in their Mobility 2030: The Metropolitan Transportation Plan were implemented. This type of analysis result–that congestion will continue to increase despite implementation of an extensive set of projects, programs and policies–is critical for target setting and establishment of public expectations.
Figure 2-9: NCTCOG Projected Congestion by 2030
Source: M2030 2009 Amendment15
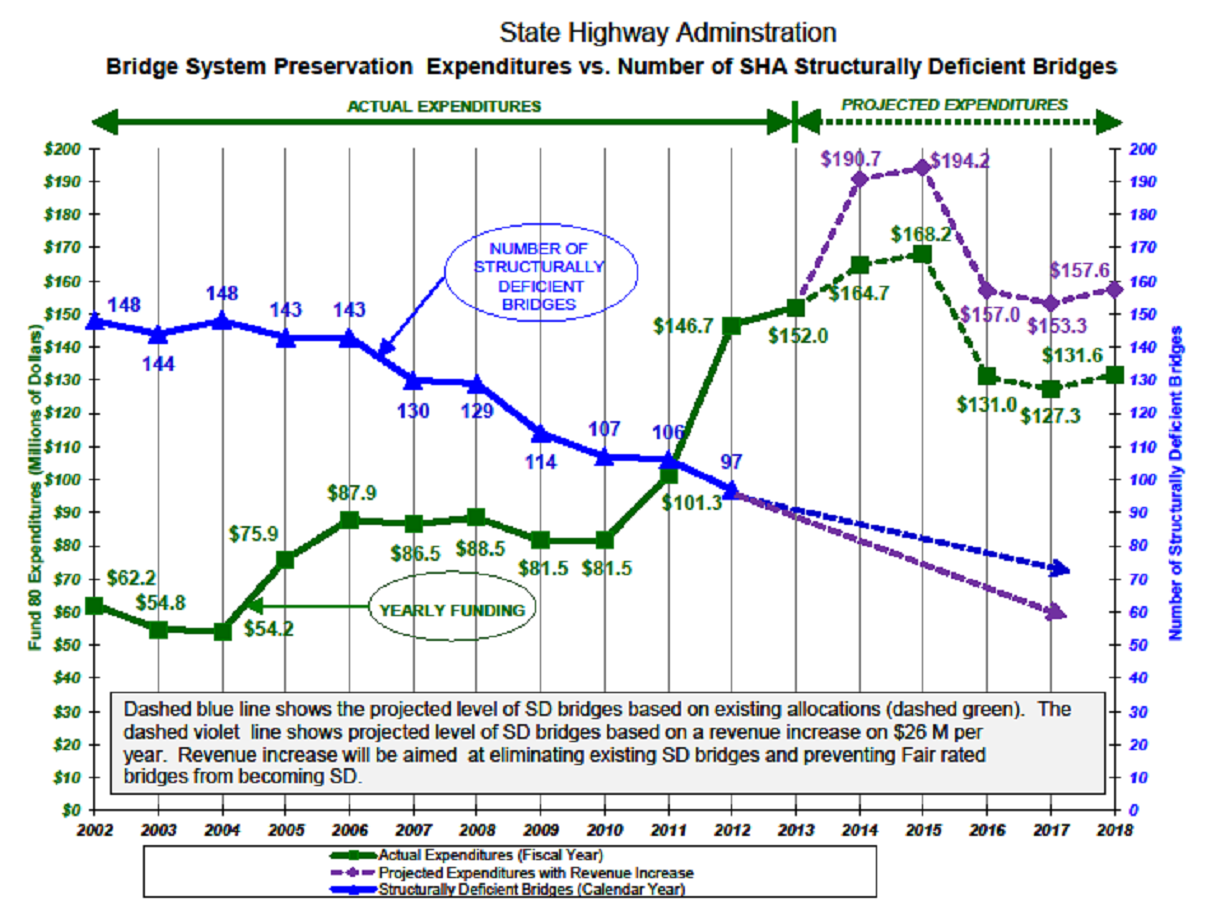
Funding Scenarios: Rhode Island DOT and Maryland State Highway Administration
Funding levels are a fundamental level for impacting performance results – and therefore analysis of funding scenarios is a common – and very helpful approach for target setting. The example below (Figure 2-10) shows bridge condition results for the Rhode Island Department of Transportation (RiDOT) based on different funding levels. The trend lines show that future performance results from the baseline are actually moving further away from the target performance. Portraying several different data lines on this chart shows the relationship between annual investment level and performance. This type of representation can be used to understand and communicate what funding levels would be required to achieve a given target. In Maryland, the ability to meet targets for structurally deficient bridges is directly linked to available funding (Figure 2-11).
Figure 2-10: RIDOT Bridge Performance Forecast
Source: Federal Highway Administration
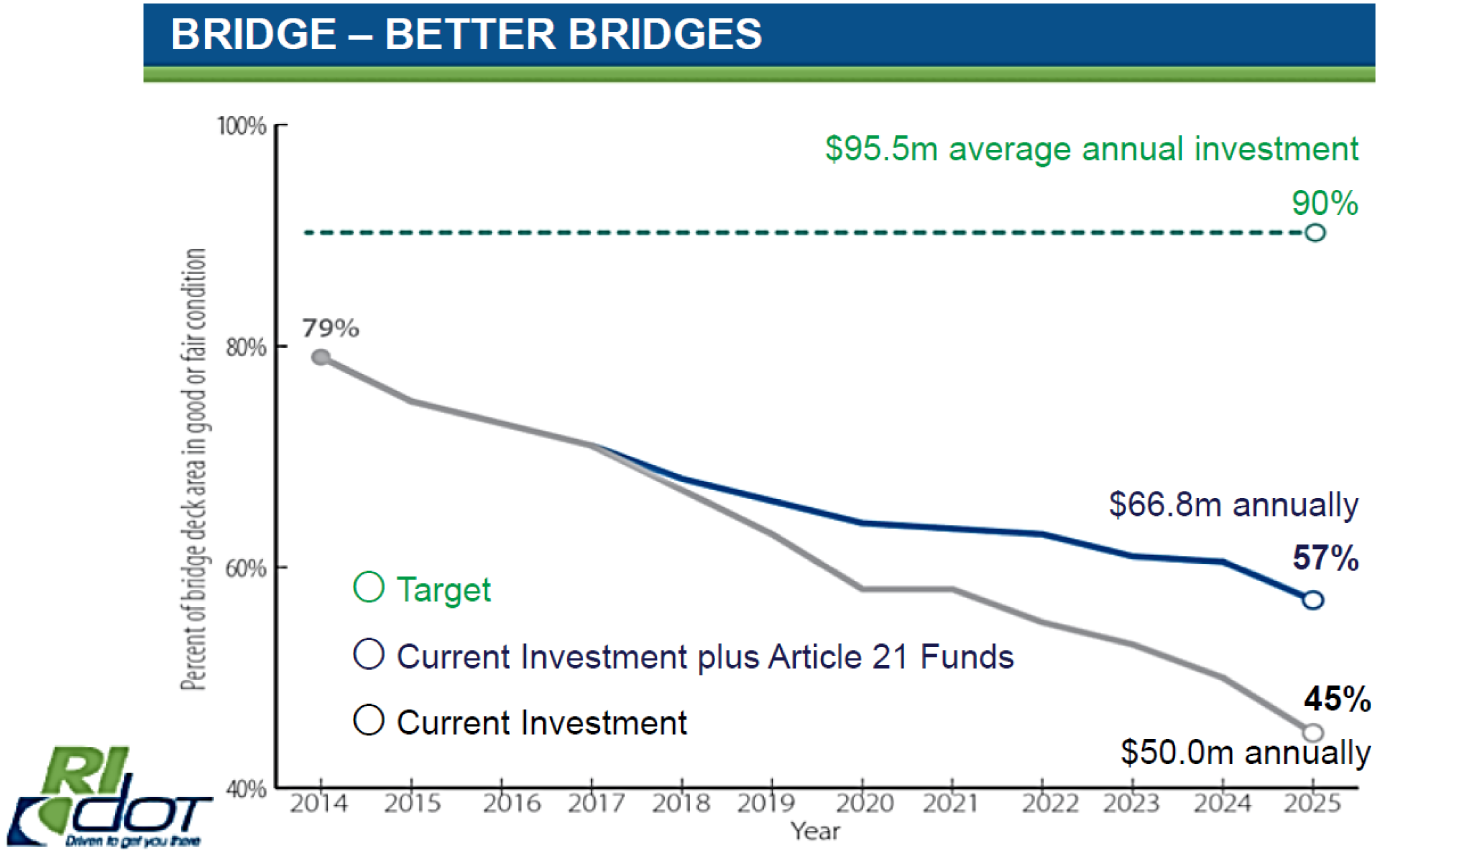
Figure 2-11: Maryland State Highway Administration Bridge Investment vs. Performance
Source: State of the State of Maryland’s Bridges16
“Agency processes such as needs evaluations, performance rating, and project prioritization can be shaped in terms that relate directly to VTrans. This consistency… promotes the alignment among policies, plans, and funding programs that is necessary to gauge accurately the effects of transportation decisions on system performance.”
Source: Commonwealth Transportation Board. (February 2013). VTrans2035 Update: Executive Summary.
Linkages to Other TPM Components
- Component 03: Performance-Based Planning
- Component 04: Performance-Based Programming
- Component C: Data Management
- Component D: Data Usability and Analysis
Step 2.1.6 Document technical methodology
The data-driven methodology for setting targets has been developed and now must be documented. The completion of this step means that an agency setting a target has a good understanding of their current status regarding data availability and capabilities, risk assessment, and tools to forecast results. This will be a rulebook and record of how the target methodology was conducted and why this approach was used. Documentation may not sound like the most exciting aspect of target setting, but it ensures the technical methodology is replicable from cycle to cycle, can withstand staff turnover, and establishes an air of transparency around target setting. Material from this document can also be used to communicate with internal staff and external stakeholders about the agency’s target-setting technical methodology.
As an agency goes through multiple cycles of target setting, update the documentation. For example, agencies may enhance their abilities to identify and understand the effect external factors have on performance results. Similarly, as various strategies are applied to improve performance, a better understanding of the linkage between actions and results can lead to improved target setting. Target setting, like many TPM components, is an iterative process, so it will be critical to document steps that were taken and subsequent adjustments made to an agency’s technical methodology.
Topics to address in the technical methodology documentation include:
- Roles and responsibilities of involved staff
- Business process milestones and schedule
- Process flow map
- Recommended adjustments for future target setting cycles
- Specific issues related to each implementation step (see Table 2-8)
Source: Federal Highway Administration
| Technical Methodology Step | Topics to Document |
|---|---|
| Establish a baseline |
|
| Analyze historical trends |
|
| Identify influencing factors and assess risk (internal and external) |
|
| Define target parameters |
|
| Forecast future performance |
|
Examples
Documentation of Technical Methodology: PennDOT
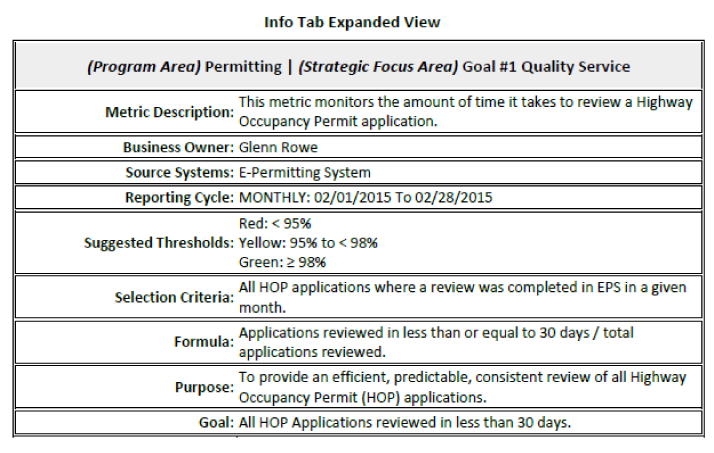
As part of the Pennsylvania Department of Transportation’s (PennDOT’s) transportation performance management approach, the agency developed a set of “Production User Manuals” to document the definition, data source, calculations, reporting cycle, and purpose for each key performance measure (see Figure 2-12 and Figure 2-13, below). These documents also describe how staff can use the Highway Administration Performance Dashboard (HAPD) to access raw data, view results, generate reports, and enter comments. Internal staff and external stakeholders responded positively to this transparent documentation of the data and technical methodology behind the targets posted on the HAPD scorecard.
“The Production User Manuals pulled back the curtain to the technical methodology behind our performance scorecard providing improved clarity and transparency to previously often assumed and frequently misunderstood processes. As a result, people’s trust in the data and published results improved because everyone knew where the numbers came from and how they were calculated.”
Source: Jim Ritzman, PennDOT
Figure 2-12: Highway Administration Performance Dashboard
Source: Highway Occupancy Permit (HOP) Application Review17
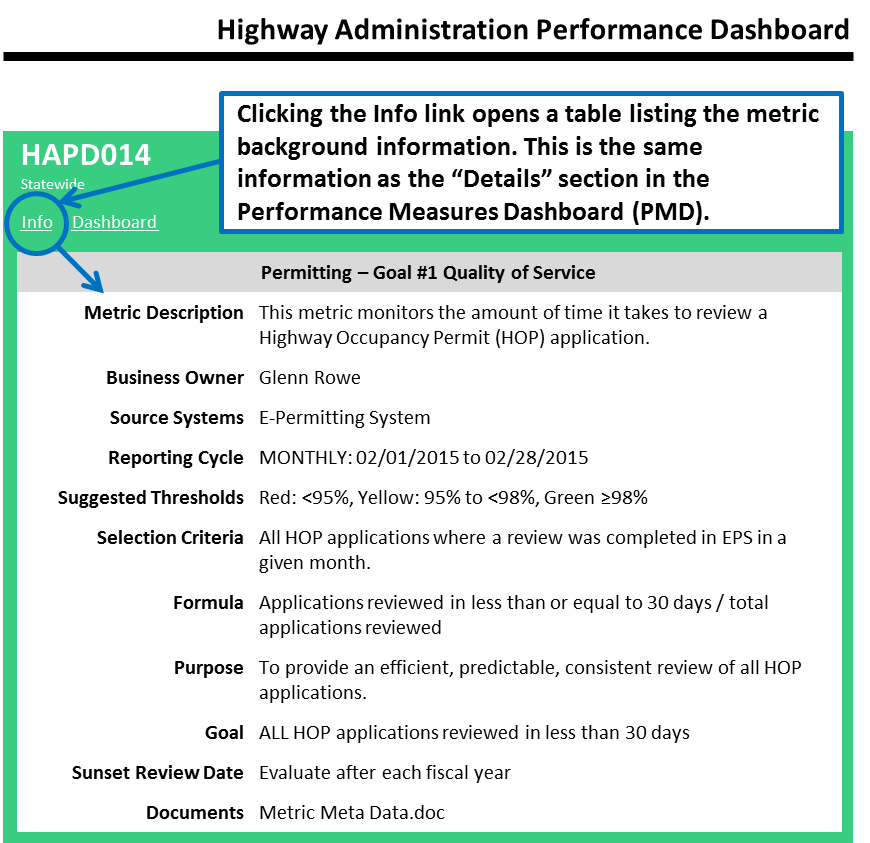
Figure 2-13: Expanded View for Specific Metric
Source: Highway Occupancy Permit (HOP) Application Review18
Process Flow Mapping: Example
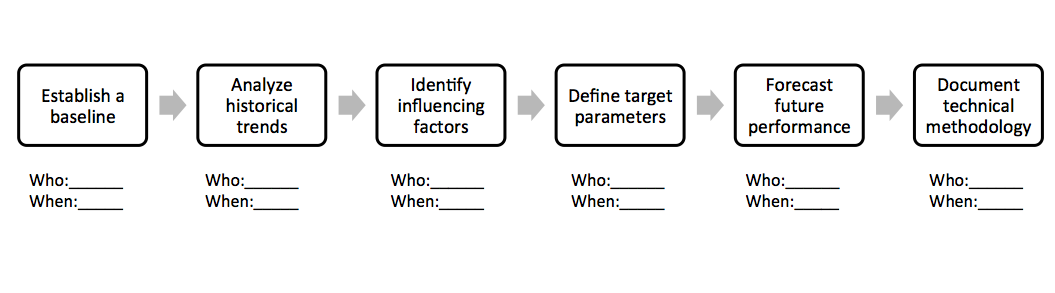
A process flow map is a useful way to illustrate how the steps of a process are interrelated. The simple act of mapping out an agency’s target-setting process can improve the understanding of the process, roles and schedule. There are many approaches to creating a process flow map, but some rules of thumb are to highlight the distinct steps taken, the flow of the steps, and any linkages between the steps. Figure 2 14 below illustrates a starting point for a process flow map for setting targets.
Figure 2-14: Process Planning with a Flow Map
Source: Federal Highway Administration
Linkages to Other TPM Components
2.2 Business Process
On the process side, staff and stakeholders need to be informed and organized so that they align positively to finalize the selection of targets. The target options identified through the technical methodology should flow into a target setting business process. The business process answers the “who” and the “how” targets will be set. The following section outlines steps agencies can follow to implement a sustainable business process to target setting.
- Assign internal roles and responsibilities
- Clarify purpose of the target
- Gather information through benchmarking
- Reflect external stakeholder interests
- Document the business process
“Montana DOT has adopted a formal process for developing targets. Over time, the state legislature has gained confidence in the process and related funding requests because it provides consistent, quantifiable performance information that is fiscally constrained. The process is well received by the districts because it sets the type of work needed to meet the targets, but provides flexibility in terms of actual project selection.”
Source: NCHRP 551 Performance Measures and Targets for Transportation Asset Management
Step 2.2.1 Assign internal roles and responsibilities
A key first step in the target setting process is the identification of who will be involved in picking the final target and what role each person will fulfill. This would answer questions related to who at each agency level is responsible for setting targets as well has how to keep all affected offices engaged. Without clarity about who is accountable for what throughout the process, or who has decision-making control, the business process will likely be ineffective.
Key roles to determine, include:
- Process leadership: Who will lead, coordinate, and marshal the target-setting business process? If target setting is new to an agency, it will be important to identify a strong process facilitator.
- Input providers: Practitioners invited to the table for the duration of the process will drive the conversation by making recommendations and suggestions to decision makers. Can include external stakeholders, but are predominately internal agency staff.
- Feedback contributors: Group of individuals whose opinion and signoff is helpful, but who, for sake of expediency and organization, do not need to be at the table as part of the input group.
- Data trackers: The tracking group may be made up of individuals also serving within capacities on the list above; this group is responsible for collecting and analyzing data used to establish and monitor performance targets.
- Decision makers: These may vary at different stages of the process, but it should be clear who has the final decision on what the final target will be.
All staff in these roles needs to understand how the baseline and target have been calculated, how they will be used, and how they will be communicated internally. They also need to understand who is in charge of decision-making and accountability, to ensure a clear chain of command and eliminate confusion and dead-ends.
Items to keep in mind as a baseline is developed:
- Identify a champion to lead the business process
- Use input from technical methodology as the business process foundation (e.g., baseline, historical analysis, forecasts)
- Ensure participants need to represent interest across agency silos (including staff who express resistance to target setting)
- Link to existing processes as much as possible (e.g., LRTP, budget development)
- Conduct an open dialogue about how targets will be used internally
- Clearly identify how targets will be finalized, including formal adoption procedures and incorporation of final targets into performance plans and processes
Examples
Internal Roles
Internally, roles and responsibilities of key players need to be defined and coordination of needs across performance areas must be established. This entails acknowledging that target choices in one performance area may affect performance in another area. For example, lowering pavement condition targets could have an impact on safety performance, or increasing mobility targets (increasing average speed for example) could impact safety. While the chance of success is reduced if one or more key people are missing at the table, bear in mind that there is a tradeoff to inviting too many voices to the conversation. A greater number of persons will make the target setting process longer and the business process more cumbersome. A rule of thumb is that when the number of persons doubles, the amount of time required will be squared (2*P=t^2). Rather than issuing a blanket invitation to all staff, consider their individual roles at the very beginning of the process, including the key decision of who is involved/invited to engage vs. who is informed after the fact
“New initiatives need good leaders.”
Source: NCHRP 8-92 Implementing Transportation Data Program Self-Assessment
Who are the internal key players? They could include:
- Agency leader (Secretary, CEO, Chief Engineer)
- Senior management
- Planning group
- Program managers
- Finance group managers/budget staff
- Performance measure drivers
- Data owners
- Technical analysts
Each of these has a role in data gathering, resource allocation or funding, and/or project selection. The group may change depending on how these tasks are assigned in your organization, and may change as the target setting process is refined. In addition, the level of involvement of staff will vary (e.g., agency leader may only be involved in the final target approval while performance measure drivers would be involved throughout the process).
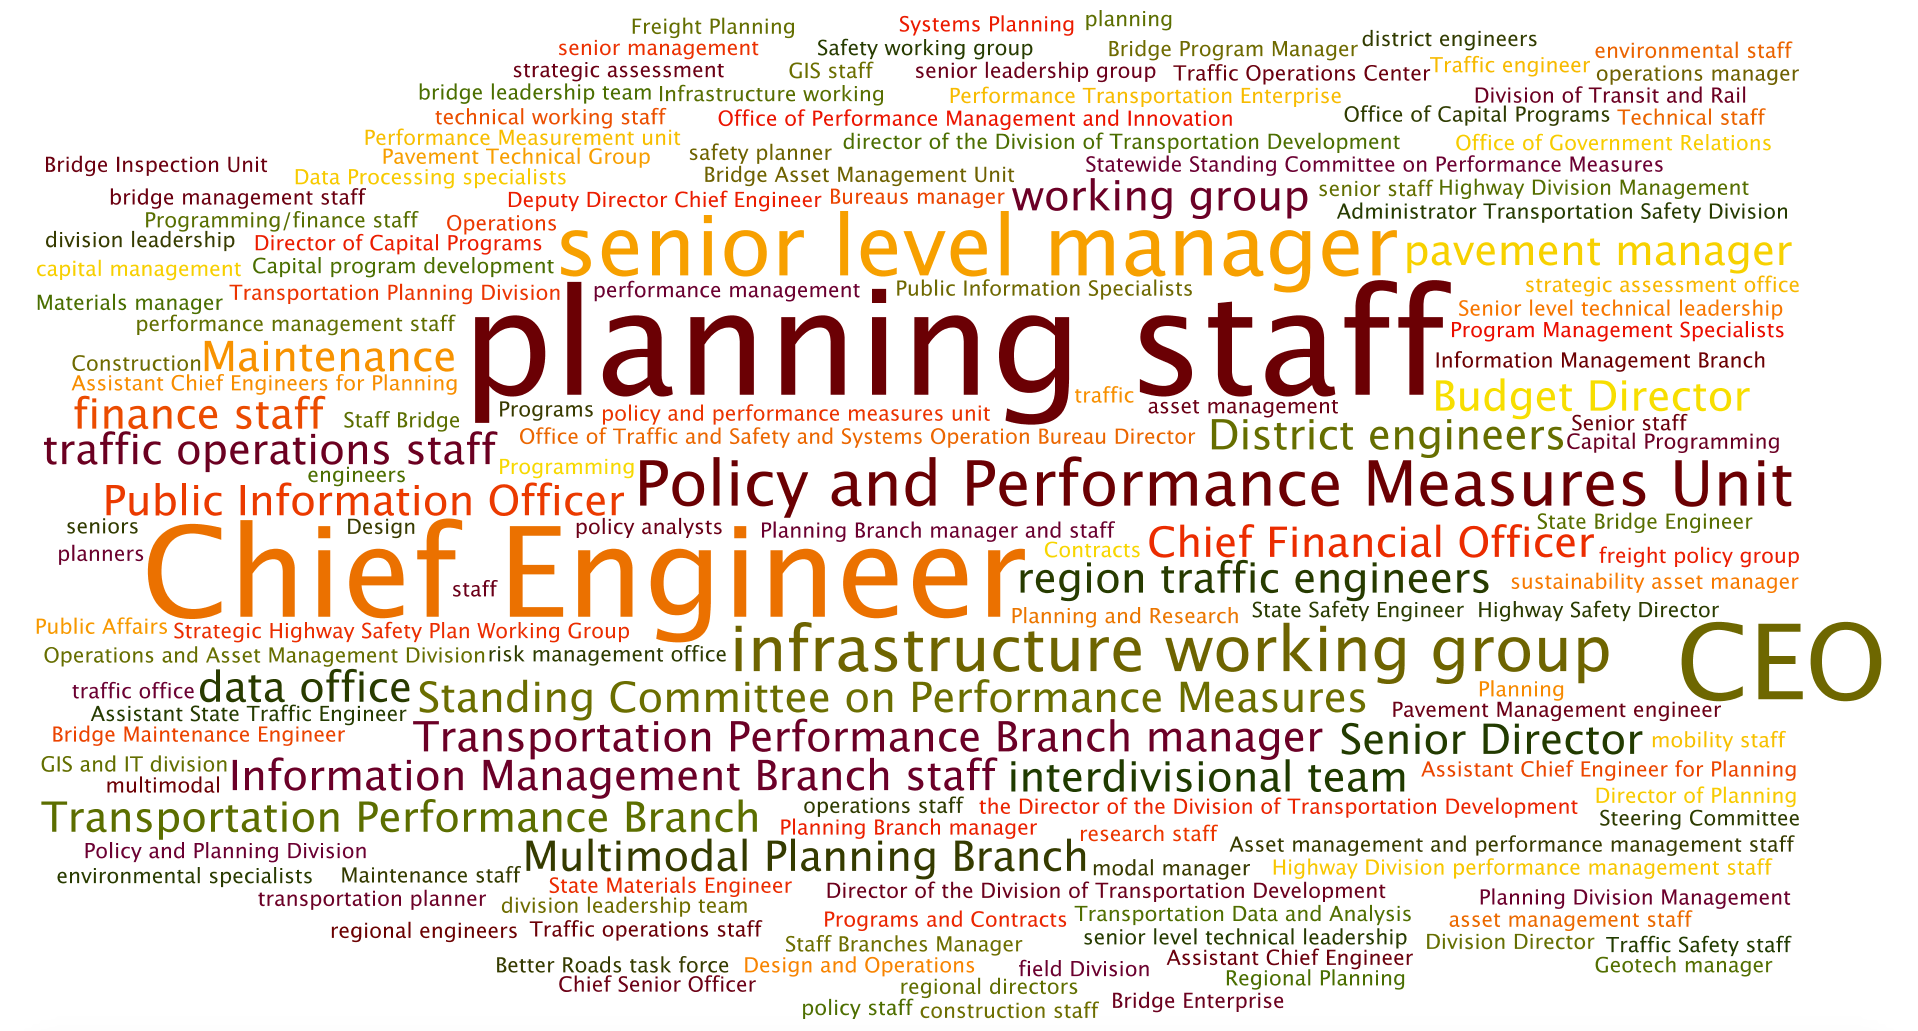
The word cloud below (Figure 2-15) is a visual representation of State DOT responses to a survey distributed prior to the AASHTO Standing Committee on Performance Management (SCOPM) MAP-21 Target-Setting Workshop held in June 2013.19 The specific question asked was, “Who within your agency would participate in the target-setting process for bridge condition, pavement condition, safety, freight, system performance and CMAQ Program”? Besides the observation that the range of practitioners involved in the target-setting process is wide, there appears to be the need to bring together the system performance area experts and planning staff.
Figure 2-15: Target Setting Stakeholders at a Glance
Source: AASHTO20
Once internal staff have been identified and the “involve vs. inform” roles clarified, it should be made clear to all stakeholders how the technical methodology (subcomponent 2.1) produced potential targets for consideration. Only if all involved are using the same set of assumptions and the same set of constraints and factors can a solid process occur.
Transportation performance management goes beyond the typical amount of coordination and collaboration of transportation planning, requiring different practice areas to consider how targets in each area relate to each other, what tradeoffs there may be, and how to support multiple goals simultaneously.21 As a result, the group involved in the target-setting business process should pull from many areas of the organization.
Linkages to Other TPM Components
- Component 03: Performance-Based Planning
- Component 04: Performance-Based Programming
- Component 06: Reporting and Communication
- Component A: Organization and Culture
- Component B: External Collaboration and Coordination
Step 2.2.2 Clarify purpose of the target
Targets can take on many different roles within an agency from motivating staff to managing external expectations. A key step in the target setting business process is obtaining an agreed-upon and well-understood purpose for the target by answering two questions: (1) Who is the intended end user or audience for the target and (2) to what degree is the target evidence- or investment-based?
- Target Audience: Who is the end user or audience of the target? Focusing a target depending on different end users can reflect different purposes, some of which can overlap.
Source: Federal Highway Administration
| Audience | Potential Purpose |
|---|---|
| Internal Staff | Motivate to improve results |
| Partners | Manage expectation and communicate investment needs |
| Leadership (i.e., Governor) | Drive focus on a specific strategic goal |
| Customers | Explain agency decisions |
| Regulatory | Meet legislative requirements |
- Evidence- or Investment-Based Target: Ideally, targets are bound to a performance period; narrow; and focused specifically on what can be achieved within the context of a set of investments, policies, and strategies defined within an implementation plan. When initially establishing targets, an agency may need a few cycles to develop its capabilities to forecast future trends. Therefore, as an agency is building its forecasting capabilities, the agency may decide to set less aggressive evidence- or investment-based targets to build confidence in the agency’s forecast trends.22
Example: Reduction of fatalities and injuries by two % for the next calendar year
Together the target audience and the aggressiveness of the target define the purpose for the target. For example, if an agency has recently experienced lower performance results and did not meet its targets, it would be counterproductive and even demoralizing to staff to set an unattainable target.
Instead, the agency may consider a less aggressive target to boost agency staff confidence. In this situation, a less aggressive target may also help build trust with external stakeholders that the agency can deliver on a “promise.” While targets may be less aggressive, they must remain evidence- or investment-based and clearly linked to relevant performance measures, objectives, and goals. The purpose of the target should also be reflected in the target parameters defined under subcomponent 2.1 Technical Methodology.
Items to keep in mind as the purpose of each target is being determined:
- Who is the target audience?
- What legislative mandates exist?
- How will results be communicated if target is or is not attained?
- To what degree is the target evidence- or investment-based?
- How aggressive is the target?
A target can be viewed as a promise to the public – so, set them with caution
Examples
Setting Aggressive, Evidence-Based Targets
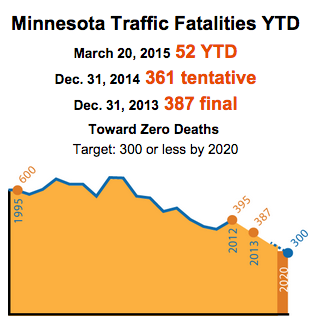
The team that manages Minnesota’s Toward Zero Deaths (TZD) initiative worked with its partners to establish an aggressive target of 300 or fewer traffic fatalities and 850 serious injuries by 2020.
This aggressive number was established through the continued implementation of their Strategic Highway Safety Plan (SHSP), examining data from previous years, determining a trend line, and eventually setting a target number that helps Minnesota DOT and its partners communicate the need to invest in various strategies to address issues concerning:
- Traffic safety culture and awareness
- Intersections
- Lane departures
- Unbelted occupants
- Impaired roadway users
- Inattentive drivers
- Speed23
The purpose of this aggressive target also allows the Minnesota TZD team and its partners to better explain to customers how investment decisions connect to progress.
Figure 2-16: Performance Targeting
Source: Minnesota Department of Transportation24
Linkages to Other TPM Components
- Component 06: Reporting and Communication
- Component A: Organization and Culture
- Component B: External Collaboration and Coordination
Step 2.2.3 Gather information through benchmarking
Simply stated, benchmarking is a method to improve performance results by looking at (a) one’s own historical patterns, (b) peer agency results, or (c) “best in class” practices. In the realm of target setting, all three types of benchmarking can provide valuable insights to the final selection of a target value. The “comparing against yourself” approach, or analyzing historical trends, was covered under the previous section (subcomponent 2.1 Technical Methodology). Gathering target information from peer agencies can clarify regional and national trends in specific performance areas, create a context for a target, and help explain a proposed target’s value to external stakeholders. However, to properly bring external target values into an internal agency’s target-setting process requires accurately identifying peer agencies (or clearly explaining the differences), confirming that similar data sources were used and ensuring consistent measure definitions were applied.
Items to keep in mind as agencies gather benchmarking information for use in target setting:
- Identify peer agencies based on similar attributes (e.g., infrastructure size, population, weather, topography, economy)25
- Beware of benchmarking information being used to incorrectly compare agencies
- Think through how the benchmark information will be used because the results may not fit the need
Examples
Benchmarking with Peer Agencies
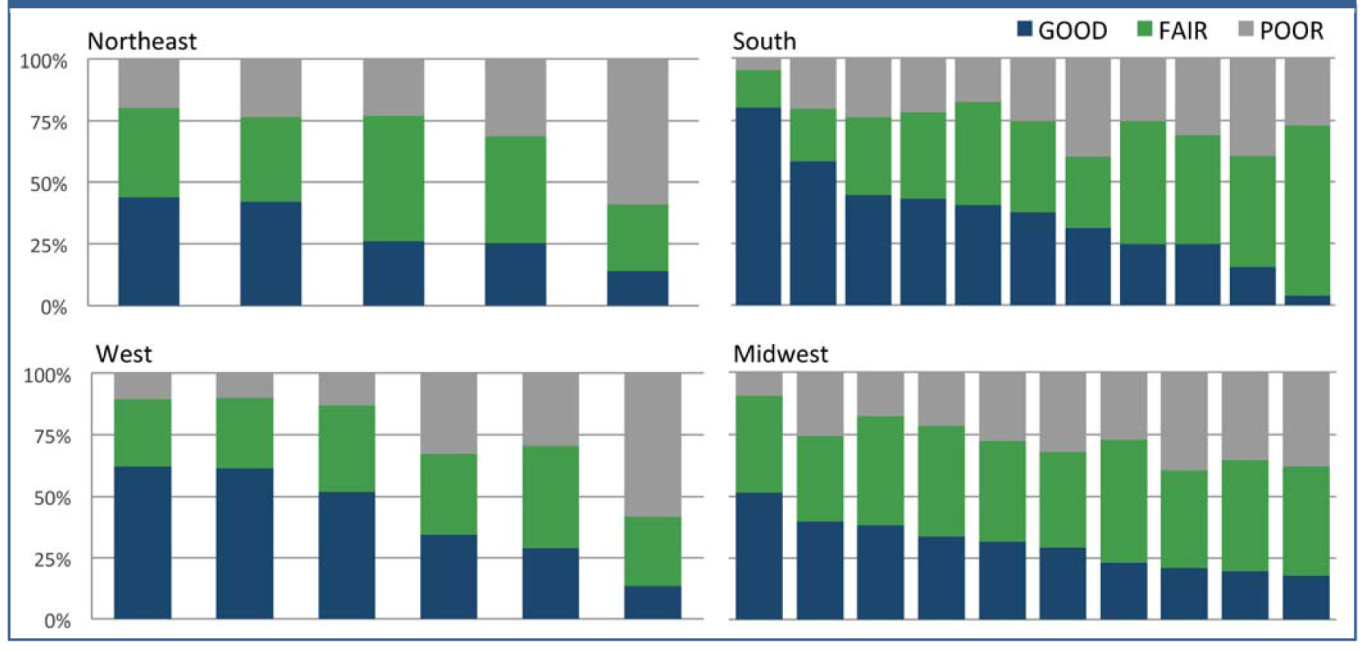
In 2004, several state DOT CEOs requested a multi-year research effort to look into the feasibility of sharing performance measurement results across agencies. As a result, ten NCHRP projects were developed (NCHRP 20-27 (37) Reports A-L)26 that created peer groupings, compiled detailed performance data, and calculated commonly-defined measures. The research series demonstrated that sharing information between agencies can provide useful insights into target setting. Pavement condition is a good example of this as seen in Figure 2 17 below, which illustrates how pavement condition has similar patterns in each of the four regions. A bar represents the percent of pavement condition in good/fair/poor condition for the participating state by region. The similar results by region suggest some factors exist (e.g., weather conditions) that affect performance results. Therefore, when looking to gather peer information for target setting, agencies should reach out to peers in their geographic areas.
Figure 2-17: Interstate Pavement Condition (2006 and 2007)
Source: State DOT Comparative Performance Measurement: A Progress Report. AASHTO, 201227
Benchmarking with “Best in Class”: Missouri DOT
“Comparing MoDOT’s customer satisfaction results against well-known private sector companies sends the message to our customers that our goal is to provide “outstanding customer service.”
Source: Karen Miller, MoDOT
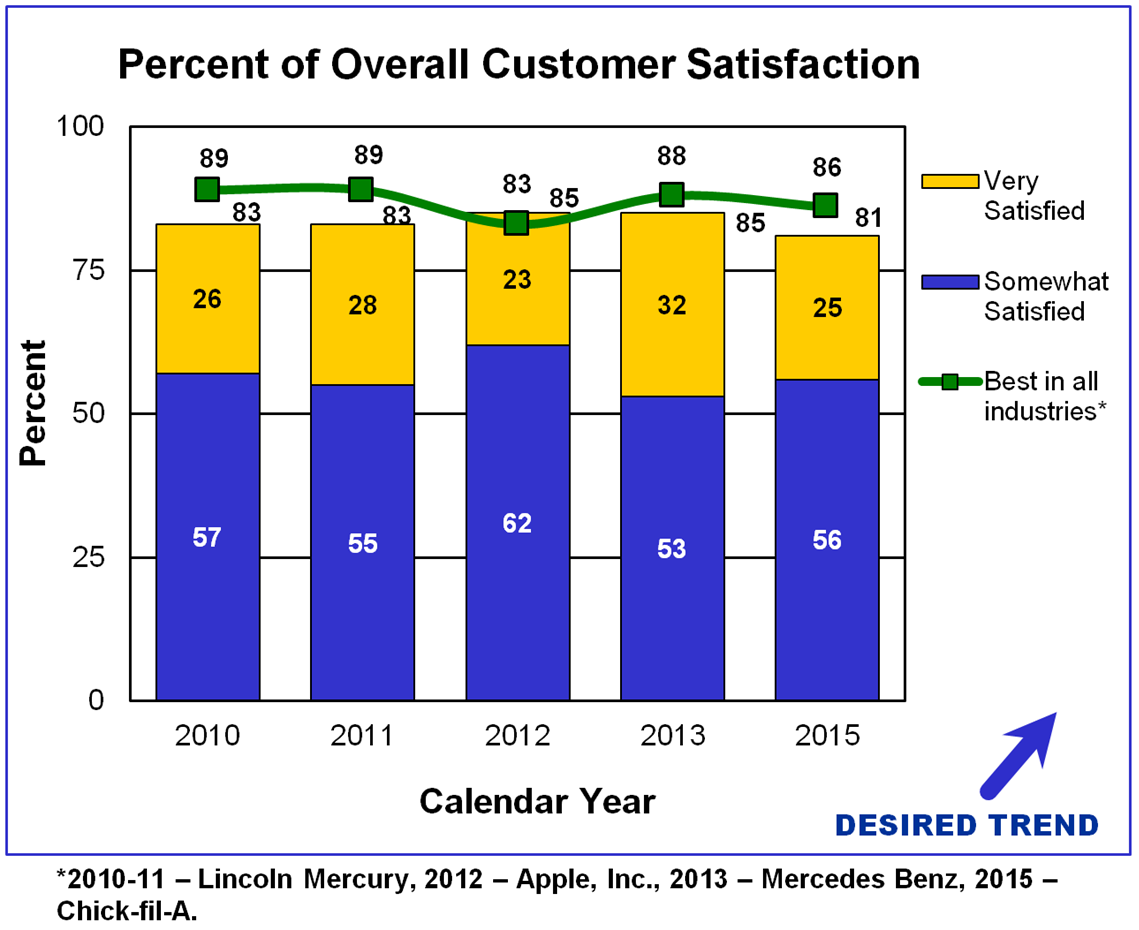
The Missouri DOT (MoDOT) considers customer satisfaction one of the agency’s key performance indicators. On a regular basis, the agency conducts a survey where calls are made to approximately 3,500 randomly selected Missourians to gather feedback. These telephone survey results are presented in MoDOT’s performance report, Tracker.28 MoDOT is unique because the agency includes customer satisfaction results from “best in class” private industries compiled by the American Customer Satisfaction Index (Figure 2 18).
Figure 2-18: Customer Satisfaction as a Performance Measure
Source: Measures of Departmental Performance29
Benchmarking: Performance Measure Definitions Matter
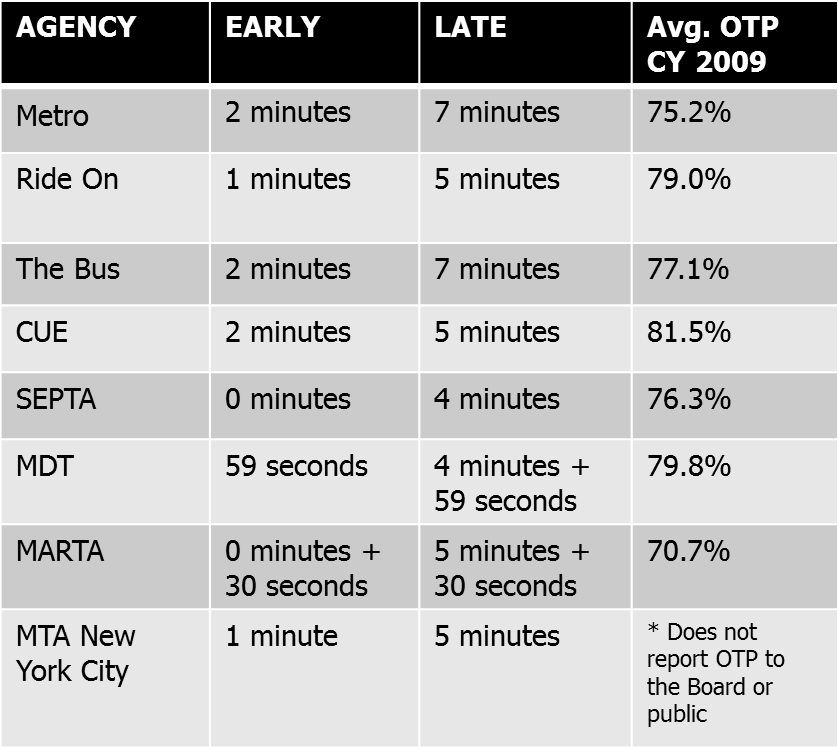
It is not uncommon for elected officials and oversight bodies to ask public agencies how proposed performance targets compare to their peer agencies. When the WMATA Board of Directors asked agency staff to defend the proposed bus on-time-performance targets to peer transit agencies, WMATA staff found themselves in a difficult situation. At the time, no industry standard definition existed for how to measure on-time performance. WMATA staff found wide diversity in the definitions used even by bus systems operating in the same area (see Figure 2 19 below). Given the absence of a consistent definition, WMATA staff recommended that the agency benchmark against itself to document improving or deteriorating on-time performance and establish targets based on baseline trends. The WMATA Board agreed to the staff recommendation.
Figure 2-19: Comparative Benchmarking for On-time Performance
Source: Bus Performance Board Nov. 201030
Linkages to Other TPM Components
- Component 06: Reporting and Communication
- Component A: Organization and Culture
- Component B: External Collaboration and Coordination
- Component C: Data Management
Step 2.2.4 Reflect external stakeholder interests
An important input for the target setting business process is listening to external stakeholders. Reflecting their interests and perspectives in agency targets helps foster positive working relationships and build support.
Who are the external key players?
- General public
- Elected officials
- Businesses
- Partners, such as MPOs, regional organizations, and local jurisdictions
- Third-party organizations, such as advocacy groups that could shape the reception of the target and/or its public face
Gathering feedback from external stakeholders is a common practice as part of agency’s planning processes. However, what is newer is the reflection of those external viewpoints in the setting of agency targets. In this new environment, it is important to acknowledge that the level of involvement of an external stakeholder and the nature of that involvement varies. For example, the general public may be “aware” of pavement condition issues, but an elected official could be a “policy changer” through directing additional funds to asset maintenance activities.
Items to keep in mind include:
- Collecting feedback on tolerable performance thresholds
- Piggy-backing on existing meetings
- Developing educational material
Note: Collaboration with external stakeholders to set agency targets will be detailed in External Collaboration and Coordination (Component B).
Examples
Understanding Public Priorities: MnDOT
During the develoment of their 2014-2033 Minnesota State Highway Investment Plan (MnSHIP), the agency conducted nine stakeholder meetings, conducted educational webinars, and created a new online interactive toolkit (see Figure 2 20 below) to better understand what performance levels stakeholders expected. Three scenarios were shared with the public representing a different mix of strategies, funding allocation, and outcomes. In addition, the public were asked to prioritize all investment categories (e.g., pavement, safety, bridge condition). The results from these external engagement efforts was then used to revise the agency’s performance targets.
“Our public engagement effort gave us valuable guidance on where MnDOT should focus our efforts and in turn how to set our performance targets.”
Source: Deanna Belden, Minnesota DOT
Understanding tolerable thresholds: MoDOT
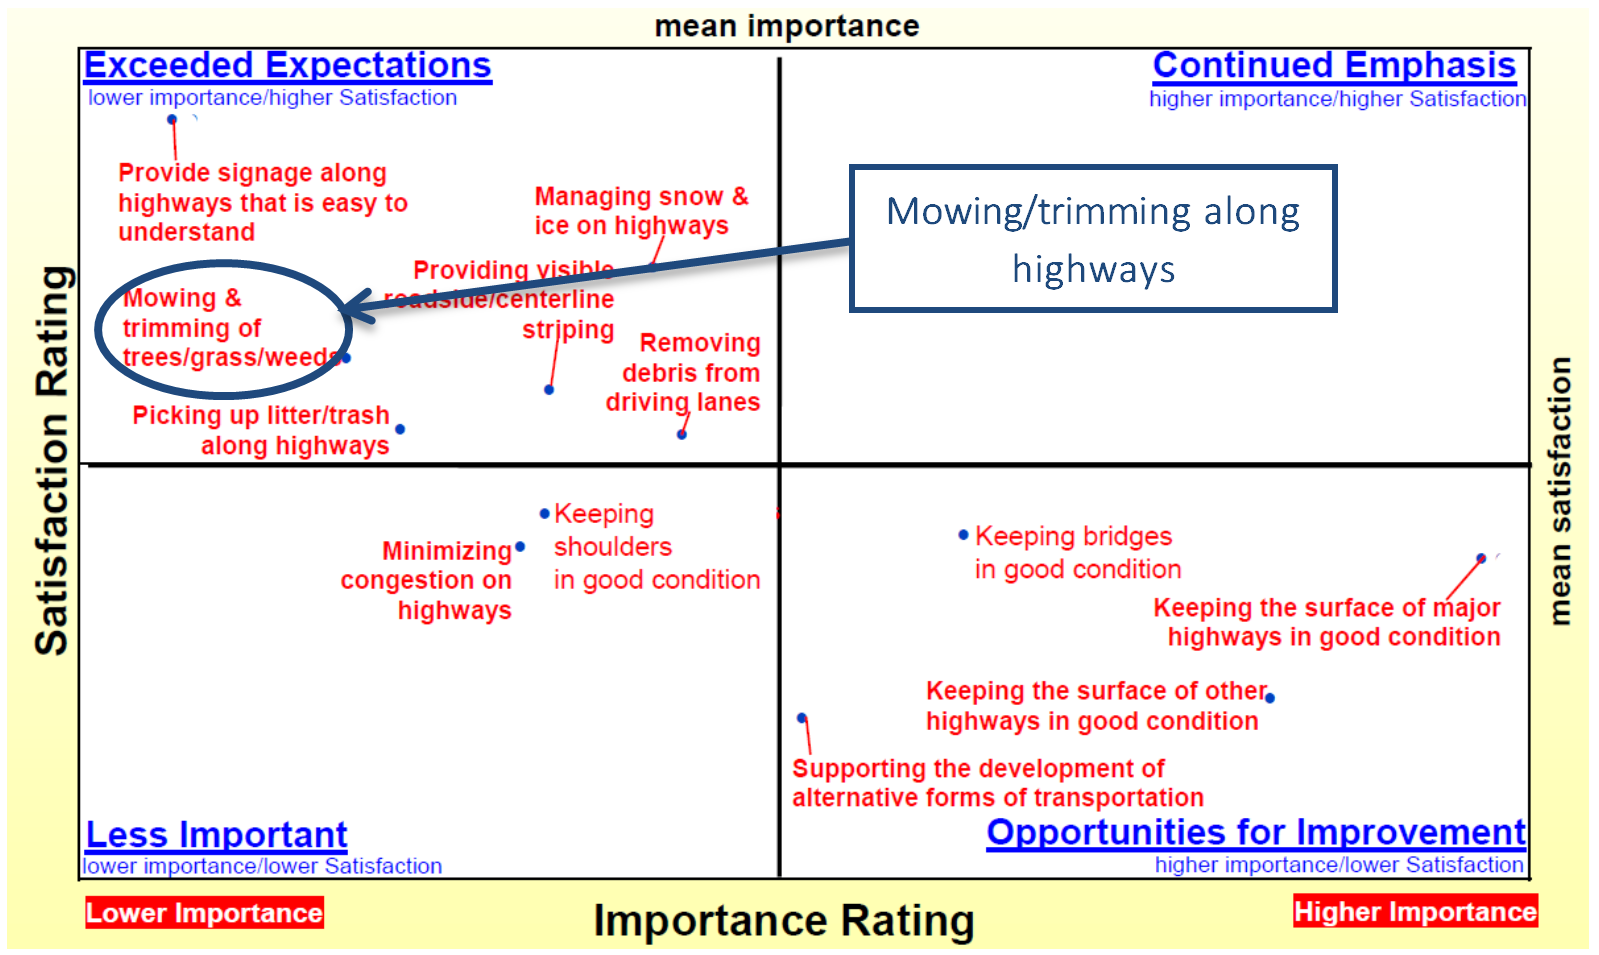
Missouri DOT’s customer report card includes an “importance-satisfaction” analysis that plots the percentage of Missourians who indicated a service offered by MoDOT is very important against the percentage of Missourians who were very satisfied (or dissatified) with that service. The simple graphic gives MoDOT direction on where to focus transportation resources. For example, in 2010 when the agency was facing a notable funding shortfall, the importance-satisfaction chart highlighted an opportunity to shift resources from one service to another. As the figure below from 2010 illustrates, Missourians were relatively satisfied with MoDOT’s mowing/trimming services, but overall this was of less importance to citizens than other services. Subsequently, MoDOT reduced its mowing practices from four to three times a year resulting in $2.5 million in savings that was reallocated to other system performance areas. The next survey showed this maintenance practice change had zero effect on customer satisfaction.
“Public opinion surveys can also be helpful in the target-setting process to understand the relationship between different transportation system performance levels and the level of inconvenience or discomfort perceived by users.”
Source: NCHRP 551: Performance Measures and Targets for Transportation Asset Management (Vol II, pg. 34)
Figure 2-20: Satisfaction v. Importance of Agency Activities
Source: Adapted from A Report Card From Missourians (2010)31
Linkages to Other TPM Components
- Component 03: Performance-Based Planning
- Component 06: Reporting and Communication
- Component B: External Collaboration and Coordination
Step 2.2.5 Document the business process
The collaborative business process for setting targets has been developed and now must be documented. The completion of this step means that staff within an agency has a clear understanding of their role in setting targets, the purpose of the targets, and an approach to reflect the interests of external stakeholders. The documentation of the business process will serve as a rulebook and record of how the process was conducted, justification for the final targets, and an explanation about why this approach was used. Documentation is not the most exciting aspect of target setting, but ensures the business process is replicable from cycle to cycle, can withstand staff turnover, and establishes an air of transparency around target setting. Material from this document can also be used to communicate with internal staff and external stakeholders the agency’s target-setting business process.
As an agency goes through multiple cycles of target setting, the documentation must be updated. For example, as agency staff becomes more comfortable with target setting, more areas of the agency may want to get involved, thus enhancing collaboration and the integration of transportation performance management practices across the agency. Target setting, like many TPM components, is an iterative process; it is critical to document any steps that were taken and adjustments made to an agency’s business process.
Targets should not be set in stone, but periodically re-examined and adjusted based on documented reasoning.
Topics to address in the technical methodology documentation include:
- Roles and responsibilities of internal agency staff
- Outline of business process milestones and schedule
- Process flow map
- Adjustments to process to implement in next target-setting cycle
- Specific issues related to each implementation step (see Table 2-8)
Source: Federal Highway Administration
| Business Process Step | Topics to Document |
|---|---|
| Assign internal roles and responsibilities |
|
| Clarify purpose of the target |
|
| Gather information through benchmarking |
|
| Reflect external stakeholder interests |
|
Examples
Business Process Descriptions
The following descriptions were adapted from State DOT responses to a survey distributed prior to the AASHTO Standing Committee on Performance Management (SCOPM) MAP-21 Target-Setting Workshop held in June 2013.
Description 1
In conjunction with each statewide long-range plan, a Governor-appointed external oversight body works with agency staff to determine appropriate targets for five to 25 years. In this iterative process, staff first reach consensus on recommended targets and then engage in back and forth discussion with the Commission over several months. The inclusion of input from other external stakeholders adds a month or two to the process.
Description 2
System performance area staff use data to identify needs, planning program staff provide traffic growth projections, results based on different scenarios established, final draft targets reviewed and approved by Executive staff with consensus from Chief Engineer/Field Division Engineers, final draft targets submitted to external oversight body for final approval. Process is marshaled along by an internal performance working group.
Description 3
Technical asset management group develops proposed targets that will be vetted through senior executive steering committee. This is an iterative process allowing functional areas the flexibility of proposing achievable targets while enabling the senior executive steering committee to provide oversight and direction until achieving objectives that are aligned with Department goals.
Description 4
Technical experts make recommendations to the executive group – which considers policy implications and implementation actions. The Statewide Congestion Working Group discusses the technical and policy aspects of target setting.
Description 5
Technical asset group at Headquarters works with regional asset managers to review data and ensure accurate reporting before projecting performance at various funding levels. Headquarters group then works with the planning and finance groups to develop forecasts for various long-term funding scenarios. For annual budget setting, these scenarios are initially presented to Senior Management including the Executive Director and Chief Engineer, and once approved to an external oversight body. Proposed targets are revisited when final budgets are established by the legislature, then signed by the Governor. The forecasted condition at the approved budget is by default the annual target. Long-range targets, however, continue to fall back to the most recent Statewide long-range plan.