Component 03
Performance-Based Planning
Implementation Steps
3.1 Strategy Identification
The following section outlines steps agencies can follow to define strategies aimed at progressing toward performance goals, and building a list of potential projects to be programmed in the performance-based programming component (Component 04).
- Clarify internal and external roles and responsibilities for effective collaboration
- Identify key performance issues for each strategic goal and objective
- Assess a strategy’s effect on outcomes
- Define and evaluate strategies against desired characteristics
- Document strategy identification process
“Planning provides a state DOT with the skills to define a consensus-based, collaborative, long-term vision for transportation reflecting the perspectives of both internal [staff] and external stakeholders.”
Source: NCHRP Report 798: The Role of Planning in a 21st Century State DOT—Supporting Decisionmaking
Step 3.1.1 Clarify internal and external roles and responsibilities for effective collaboration
The planning process begins when the roles and responsibilities are defined. This often results in the formation of a task force or leadership committee, representing diverse performance areas of the organization. It should be well supported by, and connected with, agency leadership. It is important to establish the momentum and mutual understanding of a continual effort, as performance-based planning provides direction for programming decisions.
The diverse group assembled should foster a collaborative approach and enable the evaluation of strategies across multiple goals and performance targets. This also is designed to result in the development of a broad array of strategies. In order to reflect regional context and align regional planning processes, the group should collaborate with and learn from external partners.
Source: Federal Highway Administration
| Process Leadership | Lead, coordinate, and marshal the performance-based planning process. |
| Input Providers | Drive the conversation by making recommendations and suggestions for the duration of the process. Primarily internal staff but may also include external collaborators. |
| Feedback Contributors | Review recommendations and suggestions, but for sake of expediency, provide feedback on ideas rather than additional input. |
| Trackers | Collect and analyze data used to establish and monitor performance targets. |
| Decision Makers | Determine and decide the final strategies for inclusion. |
The PlanWorks resource created by FHWA is a valuable tool for use throughout the planning process, and includes information relevant to assigning roles and responsibilities.7
It is essential that the above roles have a common understanding of how the plan will be formed, how strategies will be developed, prioritized, and included, and how the final plan will be used and communicated. All participants must also understand who is charged with decision-making and accountability, to ensure a clear chain of command and preclude confusion and false starts.
Items to tackle while assigning internal roles and responsibilities include:
- Identify key groups and champion for each
- Determine ownership of each step
- Ensure common understanding and support of framework
- Confirm timeline and expectations
Examples
Colorado’s Statewide Transportation Plan (2015-2040) provides an example of the involvement of many different groups:8
Transportation Commission: (process leadership)
Provides a policy directive, revenue projections, and continuity of leadership into programming (and with DOT goals and objectives). Commissioners serve in a leadership capacity as a board of directors for CDOT. The commission is comprised of 11 commissioners who represent specific districts. Each commissioner is appointed by the Governor, confirmed by the Senate, and serves a four-year term. To provide continuity, the commissioners’ term expiration dates are staggered every two years.
DOT staff: (input providers, feedback contributors)
For each of the agency’s performance areas, including safety, mobility, economic vitality/ planning, and maintenance.
Statewide Transportation Advisory Committee (STAC): (input providers, feedback contributors)
A group of elected or appointed officials representing five metropolitan planning organizations (MPOs) and 10 rural Transportation Planning Regions throughout the state.
Advocacy groups: (input providers, feedback contributors)
Rocky Mountain Wild, Colorado Natural Heritage Program, Southwest Energy Efficiency Project, The Nature Conservancy
State and Federal agencies represented: (feedback contributors)
- Federal Highway Administration (FHWA)
- US Bureau of Land Management (BLM)
- Colorado Department of Public Health and Environment (CDPHE)
- US Fish and Wildlife Service (FWS)
- State Historic Preservation Office (SHPO)
- US Department of Housing and Urban Development (HUD)
- Federal Transit Authority (FTA)
Tribal Governments: (input providers, feedback contributors)
Southern Ute Tribe, Ute Mountain Ute Tribe
Public: (feedback contributors)
Over 60,000 members of the public provided input.
Figure 3-4: The Planning Process Cycle
Source: Transportation Matters: Statewide Transportation Plan 2040 Executive Summary9
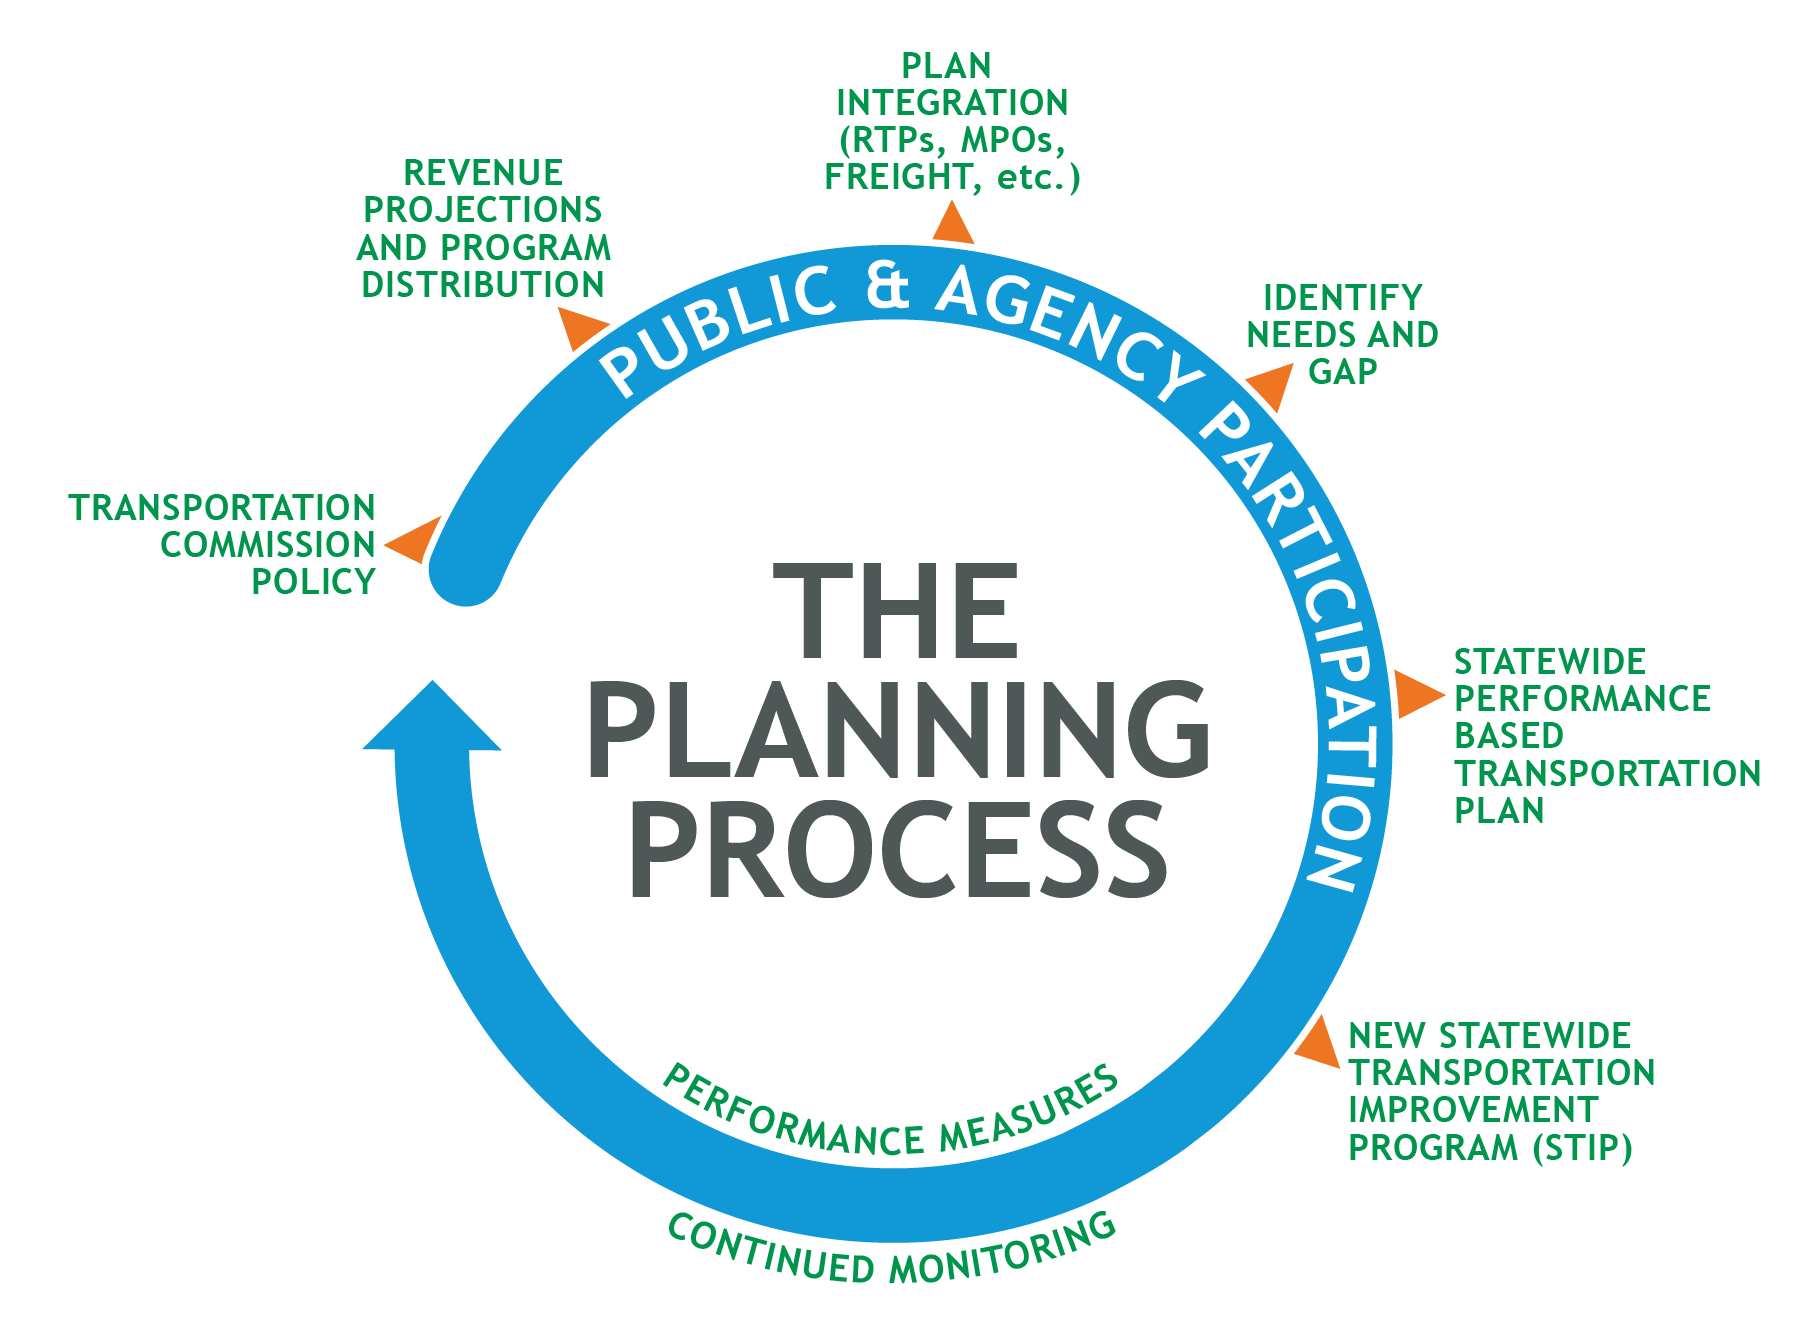
The role of each group can be seen in the planning process graphic from the CDOT plan. The Transportation Commission, as process leadership, kicks off the planning process with their policy directive. They also contribute the revenue projections and program distribution. Then the STAC and other organizations bring their own plans and input to the table, identifying needs and gaps. The final plan is then approved and adopted by the Transportation Commission.
Linkages to Other TPM Components
Step 3.1.2 Identify key performance issues for each strategic goal and objective
This step requires the examination of current performance results related to each strategic goal and objective to identify the performance needs to be addressed. Having S.M.A.R.T. objectives, as discussed in the PBPP Guidebook10 and in Strategic Direction (Component 01), may help an agency determine key performance issues. Baseline information should be examined to provide context on key issues and trends, whether those trends are negative or positive, and the sources of the information.11 An understanding of baseline data and past conditions, as well as future needs, is vital to identify where the plan’s strategies should focus. For example, if baseline data on pavement condition showed declining trends, it would be flagged as a key concern. A resulting strategy could be to resurface a specific number of miles of pavement per year.
In addition to relying on baseline data, key issues or concerns may be driven by agency priorities (e.g., safety) or legislative mandates (e.g., % of structurally deficient bridges). To better understand the context of these key issues and concerns, and to anticipate potential future issues, the agency should review the internal/external factors identified during target setting. As a reference, the table below lists potential influencing factors for performance:
Source: Federal Highway Administration
| Internal | External |
|---|---|
| Funding | Economy |
| Staffing constraints | Weather |
| Data availability and quality | Politics/Legislative requirements |
| Leadership | Population growth |
| Capital project commitments | Demographic shifts |
| Cultural barriers | Zones of disadvantaged populations |
| Agency priorities | Vehicle characteristics |
| Agency jurisdiction | Model shares |
| Senior management directives | Gas prices |
| Policy directives (e.g., zero fatalities) | Land use characteristics |
| Cross performance area tradeoffs | Driver behavior |
| Collaboration across agency | Traffic |
Examples
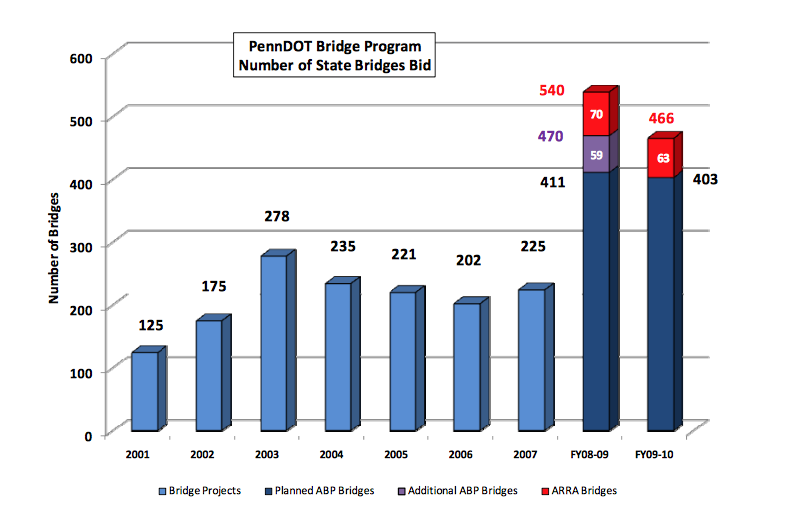
Pennsylvania Department of Transportation’s Prioritization of Bridge Needs
With 25,000 state owned bridges, Pennsylvania has the third-largest number of bridges in the nation. The state has led with the highest number of bridges classified as structurally deficient (SD); at the peak, PennDOT had 6,034 SD bridges. Recognizing this as a key system issue, PennDOT identified bridge maintenance as a strategy to improving their bridge system condition. While the number of bridge projects bid upon between 2001 and 2007 varied between 125 and 278 per year, beginning in 2008-2010 the number increased significantly to 540, including those funded by Accelerated Bridge Program (ABP) and American Recovery and Reinvestment Act (ARRA) funding.12
Figure 3-5: 2010 Report Card for Pennsylvania’s Infrastructure
Source: Bridges: 2010 Report Card for Pennsylvania’s Infrastructure: Bridges13
While this means that bridge work did accelerate over the following years, it also means that resources directed toward bridges were not directed toward other areas, resulting in a tradeoff. As funds were funneled into maintenance, fewer resources were available for other areas such as mobility. As seen in Figure 3-6, below, during the time that funding was increasing for bridge repair, the percentage of mobility (capacity adding) projects of the total dropped dramatically.14
Figure 3-6: Data from the Pennsylvania Transportation Performance Report 2013
Source: Bridges: 2014 Report Card for Pennsylvania’s Infrastructure15
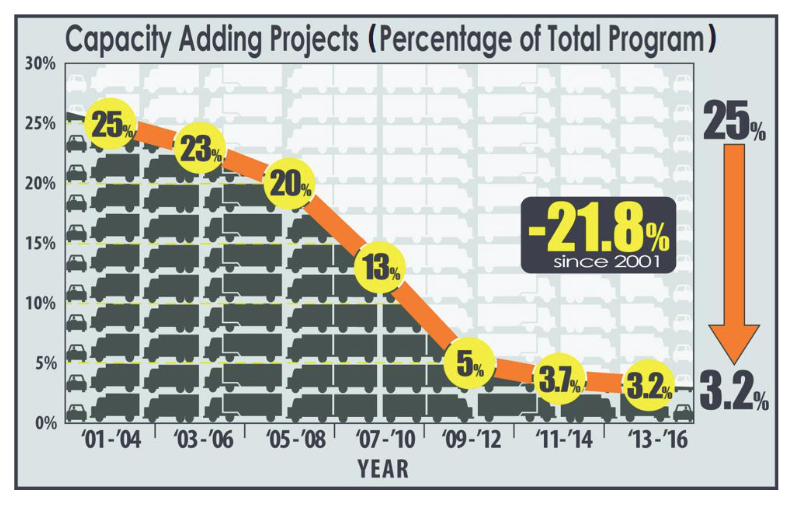
This example illustrates how an agency develops strategies to address a prevalent performance issue and how those decisions can affect other performance areas. PennDOT prioritized repair to improve aggregate bridge condition over adding new capacity, a sensible approach since one must maintain what one builds. Nonetheless, this is a tradeoff: as a plus, they are working toward improving the total system condition; as a negative, they may be falling behind in adding capacity needed to keep up with demand.
Linkages to Other TPM Components
- Component 01: Strategic Direction
- Component 02: Target Setting
- Component 04: Performance-Based Programming
- Component C: Data Management
- Component D: Data Usability and Analysis
Step 3.1.3 Assess a strategy’s effect on outcomes
In this step, agencies analyze how specific strategies will affect future performance outcomes using forecasting tools, economic analyses, and management systems. The purpose is to determine if a specific strategy provides the means to go from current conditions/baseline data toward achievement of performance goals. Agencies may find it beneficial to define various scenarios to test if the effect of a strategy may be to enhance or to throw off track.
In order to gain additional perspective on setting strategies, it is beneficial to review the efficacy of past strategies on achieving projected performance outcomes and making progress toward strategic goals. This before and after analysis will provide continuity between different iterations of long term plans. An agency’s ability to assess strategies will depend on the resources (both staff time and tools) available.
During this step, an agency assesses the risk regarding each strategy developed. Assessing risk means understanding the potential impacts of internal and external factors, their likelihood, and their severity for each strategy. Addressing risk means acknowledging these potential impacts and creating strategies that have the flexibility to accommodate these events or at least mitigate their effects.
Strategies are typically assessed in a range of planning documents:16
- MPO LRTP
- State DOT LRTP
- Asset management plans
- State supporting planning documents (SHSP, state investment plan, etc.)
- Non-metropolitan regional transportation planning organizations (often known as RTPOs or RPOs)
- Transit operators, often through a transit development plan (TDP)
- From local governments
- Public “calls for projects” issued by State DOTs or MPOs
Examples
The Florida Department of Transportation (FDOT) recognized the need to address nonrecurring congestion caused by traffic incidents in order to make progress toward their mobility goal. A proposed strategy to address nonrecurring congestion was the development of the Florida Road Ranger Program17, a system of incident response that would address all districts along the Florida Turnpike. Between its implementation in 2000 and a study conducted in 2005, the FDOT Road Rangers provided more than two million assists to motorists over more than 1,000 centerline miles of Florida’s busiest roadways. Assists include lane clearance and traffic control during incidents, fuel and tire changing assistance, cell phone calls for car service, and other quick fixes to get disabled vehicles off the freeway and reduce the potential for secondary incidents and extended resultant congestion.
To assess the efficacy of the Road Rangers as a strategy, FDOT collects the following performance measures:
- Number of assists provided to motorists
- Number of miles of freeways covered
- Incident duration
- Travel time reliability
- Customer satisfaction
FDOT has found that the Road Rangers patrols have a significant and cost-effective impact on these performance areas, saving 1,138,869 vehicle hours of delay and 1,717,064 gallons of fuel during the study period. FDOT also found that, although the program cost approximately $1.1 million statewide, it has added up to about $29.2 million in savings. The cost-benefit ratio is much better than other traditional mobility enhancement projects such as construction of new or expansion of existing roadways.18
Source: Federal Highway Administration
| Category | Details |
|---|---|
| Performance Area |
|
| Performance Measurements |
|
| Performance Goals |
|
| Target |
|
| Strategy |
|
| Results |
|
Linkages to Other TPM Components
- Component 01: Strategic Direction
- Component 02: Target Setting
- Component C: Data Management
- Component D: Data Usability and Analysis
Step 3.1.4 Define and evaluate strategies against desired characteristics
This step ensures that the plan spells out a clear connection between strategies and strategic goals.
Define the characteristics of each strategy including:
- Scope: What is the geographic reach? What is the timeframe? (For strategies these can vary within the typical statewide 30-year scope of a plan document)
- Owner: Who is the leader of this strategy, who implements it, and who tracks it?
- Mode: Passenger, freight, automobile, pedestrian, etc.
Explain why the strategy will work, offering information to back up its importance and its anticipated effects. This builds on the data examined in the previous step to create a narrative fully explaining each strategy. Define the anticipated outcome, and determine how the outcome will be evaluated. Include how efficacy will be measured, linking back to performance measurements, and specifying the exact measures applying to each strategy. During evaluation, it should be easy to answer yes or no as to whether the goal was accomplished and the strategy was effective. An agency’s ability to evaluate strategies will depend on the resources (both staff time and tools) available.
Examples
What Moves You Arizona, the Arizona Department of Transportation’s statewide long-range transportation plan, was selected as a model LRTP by FHWA. One of the plan’s many strengths is its connection between strategies and goals. Figure 3-7 below illustrates strategies under consideration by goal area and Figure 3-8 lists strategies that connect back directly to the agency’s list of Goals and Performance levels. The plan defines each of the strategies, current usage and efficacy, and other information to illustrate the reasoning behind them. It also provides implementation strategies for each.
Figure 3-7: Building a Bridge between Goals and Strategic Plans
Source: What Moves You Arizona: Long-Range Transportation Plan 2010-203519
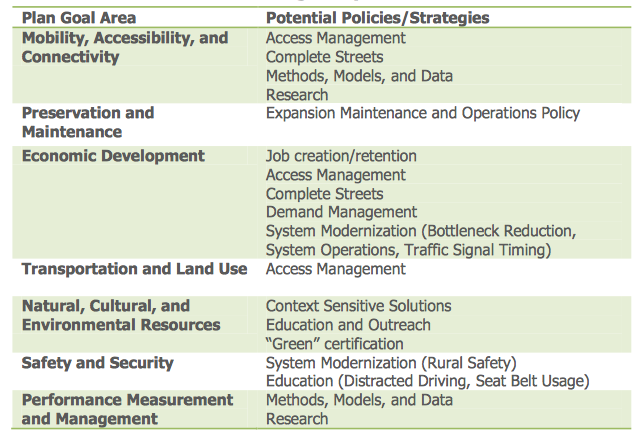
Figure 3-8: Measuring Goals with Performance Measures
Source: What Moves You Arizona: Long-Range Transportation Plan 2010-203520
Linkages to Other TPM Components
Step 3.1.5 Document strategy identification process
This step calls for documenting the strategy identification process. While this step is listed last, documentation should begin with the first step and continue throughout the process of implementing performance-based planning. The completion of this step means that an agency developing strategies has a good understanding of its current status regarding key issues or concerns surrounding their goals and respective strategies as well as its forecasting tools, economic analyses, and management systems.
The documentation step builds a record of how the strategy identification and planning process was conducted, who the stakeholders are, and why certain approaches were chosen. This reiterates the agency’s overall goals for the planning process, can be rolled into a section of the LRTP, and serves as an important communications element with stakeholders. This documentation ensures that the planning and prioritization methodology will be well-defined and replicable for future plan updates. With each iteration of the LRTP, this documentation should be updated. As strategies are implemented, new understanding of their effects will come to light.
Specific topics to document include:
- Roles and responsibilities of involved staff
- Outline of business process milestones and schedule
- Process flow map
- Recommended adjustments for future target setting cycles
- Specific issues related to each implementation step
Source: Federal Highway Administration
| Strategy Identification Step | Topics to Document |
|---|---|
| Clarify internal and external roles and responsibilities |
|
| Identify key issues or concerns |
|
| Assessment of a strategy’s effect on outcomes |
|
| Evaluating Strategies |
|
Examples
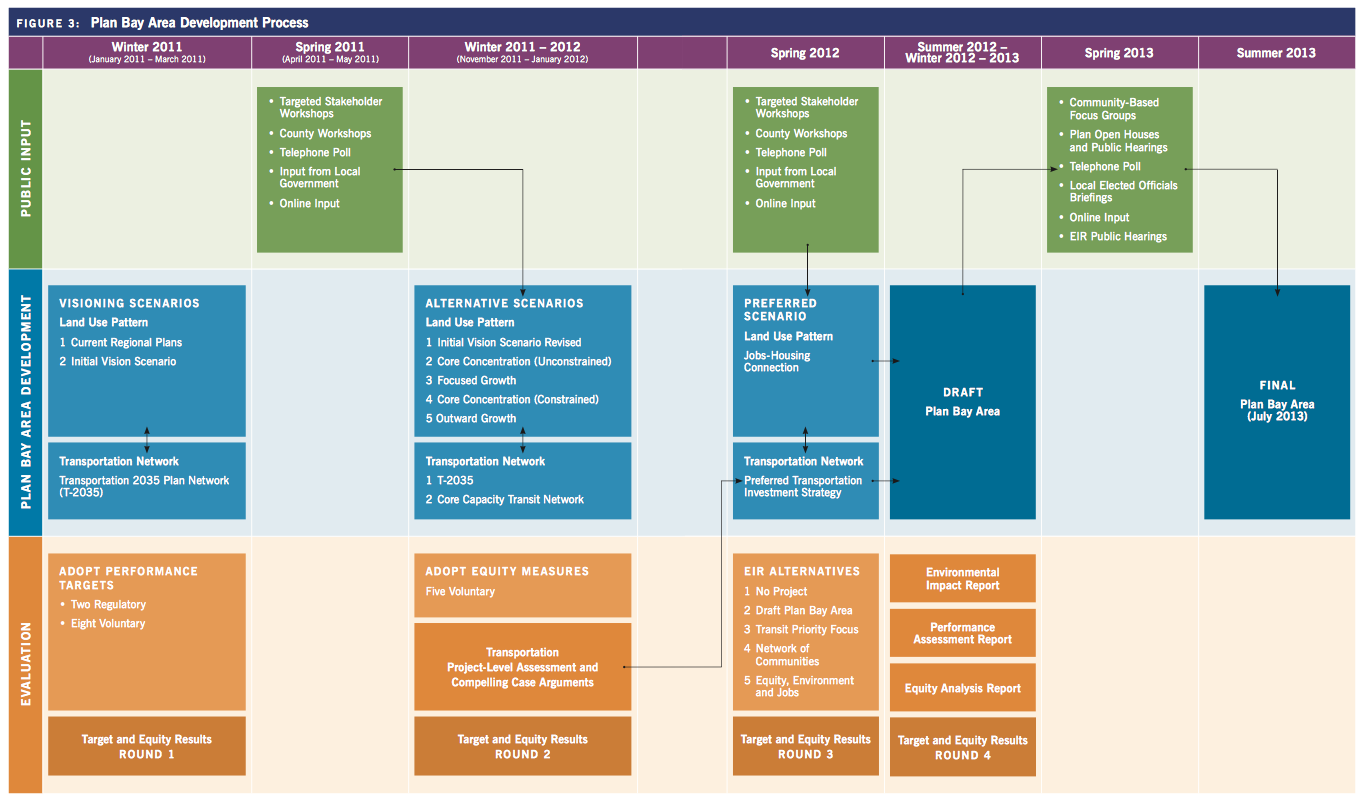
Plan Bay Area, adopted in 2013 by the Metropolitan Transportation Commission (MTC), the MPO for the San Francisco Bay Area, and the Association of Bay Area Governments (ABAG), provides an excellent documentation example. The plan spends the first several pages describing the agencies’ process for collecting input from a variety of sources to develop a list of agreed-upon targets, then exploring strategies within them. It provides an extensive narration of how the plan was developed, including all of the elements listed above, as well as a graphical representation in Figure 3-9 and Figure 3-10 below. The charts display how and when information was gathered, scenarios built and tested, and those implemented measured and evaluated.
Figures 3-9 and 3-10: Plan Bay Area Development Process
Linkages to Other TPM Components
3.2 Investment Prioritization
The following section outlines steps agencies can follow to prioritize and finalize the list of potential strategies that were drafted in subcomponent 3.1 Strategy Identification. Through this series of steps, an agency develops an understanding of how tradeoffs across agency performance areas are part of the prioritization process.
- Assign internal roles and responsibilities
- Develop scenarios to evaluate strategies
- Establish relative importance of strategic goals to guide strategy prioritization
- Document investment prioritization process
“Prioritizing investments across new construction, operational improvements, and modes will promote a more cost-effective and sustainable transportation system.”
Source: NCHRP Report 798: The Role of Planning in a 21st Century State DOT—Supporting Decision-making
Step 3.2.1 Assign internal roles and responsibilities
This step specifies staff and designates roles and responsibilities. Staff taking part in the process of investment tradeoff and strategy prioritization should be sourced from across performance areas in order to achieve multiple goals and understand the tradeoffs between them. There should be overlap, if not congruency, between this group and those discussed in subcomponent 3.1 in order to foster coordination and consistency. The group members must have a common understanding of the strategic direction and its goals and objectives, as well as established performance measures and targets. A leadership role must be defined and understood as to who will marshal this part of the process along. It should be clear who makes final decisions and how results will be utilized toward making programming decisions.
Examples
See Step 3.1.1.
Linkages to Other TPM Components
Step 3.2.2 Develop scenarios to evaluate strategies
This step involves bundling strategies into groups or scenarios, understanding how performance areas rank in priority, and determining what tradeoffs are necessary to move the agency toward attainment of strategic goals as identified in Strategic Direction (Component 01). This step focuses on prioritization of performance areas, whereas the following step focuses on prioritization of goals.
Staff decides what funding levels are likely and which should be evaluated. Portfolios of strategies should be evaluated together using scenario planning. Scenario planning is an analytical approach to evaluating how various combinations of strategies (scenarios) could potentially impact system performance at full scope of a performance-based plan, usually statewide.23 Refer to FHWA’s PlanWorks resource for further information about scenario planning and developing strategies.24 This expands the comparison of goals to baseline projections to involve scenarios tested against performance outcomes rather than singular strategies. The combination of strategies within scenarios and consideration of those scenarios should be an interactive process with all stakeholders (including the public) and guides the conversation about making tradeoffs within the constraints of different funding levels. An agency’s ability to assess scenarios will depend on the resources (both staff time and tools) available.
Examples
Minnesota DOT developed three scenarios in its recent Strategic Highway Investment Plan (MnSHIP). During this stage of the planning process, MnDOT developed scenarios to understand the investments needed to meet its performance targets. The agency created a range of performance level options within each investment area. These were clearly illustrated to stakeholders in order to guide the discussion on tradeoffs required in each combination of performance levels and investment levels.
Figure 3-11: Evaluating Investment Approaches
Source: MinnesotaGO: 20-Year State Highway Investment Plan, Executive Summary25
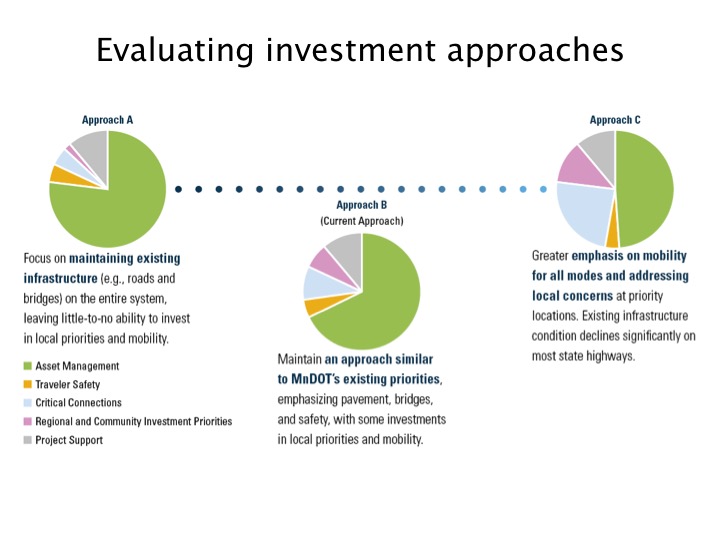
Source: Federal Highway Administration
| Scenario | A: Focus on maintaining existing infrastructure | B: Maintain existing approach | C: Focus on mobility for all modes and on local concerns |
|---|---|---|---|
| Pro | Improving performance regarding system preservation | Seemingly more equitable distribution of investment | More fundingfor mobility and local priorities |
| Con | Little funding left available for mobility enhancements (system explansion) and/or local priorities | Business as usual, less progress toward some performance goals | Significant deterioration of conditions on state highways |
The development and discussion of these scenarios showed the public and other stakeholders what the tradeoffs were within the funding constraints. Funding levels raised in one area must naturally fall in another, revealing how meeting local demands would cause the agency to fall out of Federal guidelines in another.
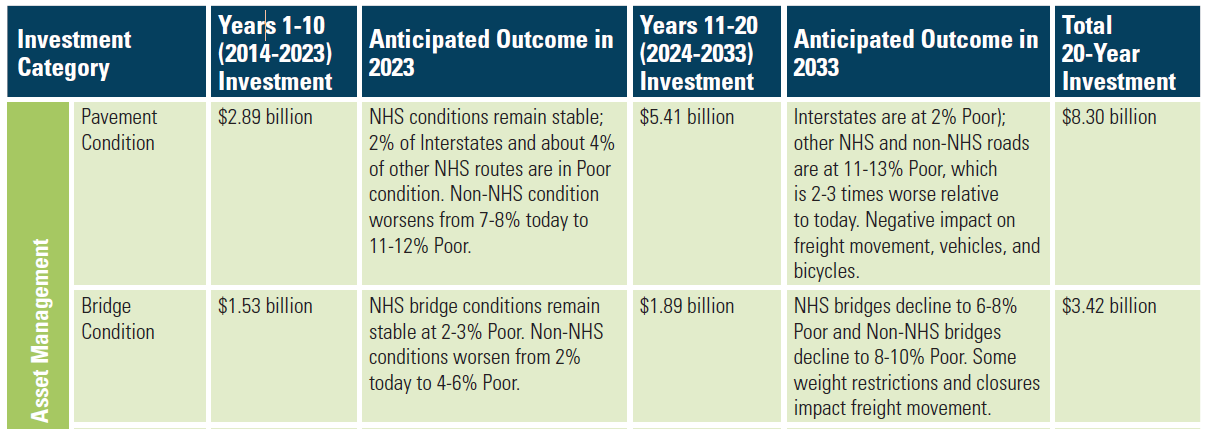
The result of MnDOT’s scenario planning efforts includes an updated approach on a 20-year plan, with an emphasis on risk. The plan splits priorities between two 10-year periods, rather than embrace one set of priorities for the full 20 years, acknowledging the need to respond to governmental requirements and adjust existing priorities and assumptions. This balanced approach allows MnDOT the ability to make progress in all investments in the short-term, while continuing to focus on existing infrastructure for the longer term.
Figure 3-12: MnDOT Investment Strategies in Relation to Expected Outcomes
Source: MinnesotaGO: 20-Year State Highway Investment Plan, Executive Summary26
Linkages to Other TPM Components
- Component 02: Target Setting
- Component 05: Monitoring and Adjustment
- Component 06: Reporting and Communication
Step 3.2.3 Establish relative importance of strategic goals to guide strategy prioritization
In this step, an agency develops a methodology for determining the relative priority of different goals and performance outcomes. This is necessary for the plan to provide a clear strategic direction for the agency and support decision-making. In order to do this, the tradeoff analysis developed in the scenarios above should be considered in addition to the relative need across performance areas.
The most important part of this step is selection of the final strategies to be included in the long-range transportation plan or other performance-based plans, chosen from the list of strategies developed in subcomponent 3.1, and confirmed as feasible by the scenario planning in the previous step. The final list of strategies must be strongly connected back to the performance measures and goals. The list of strategies, scenarios, and measures should be reaffirmed by all stakeholders and then drafted into the final plan format.
Examples
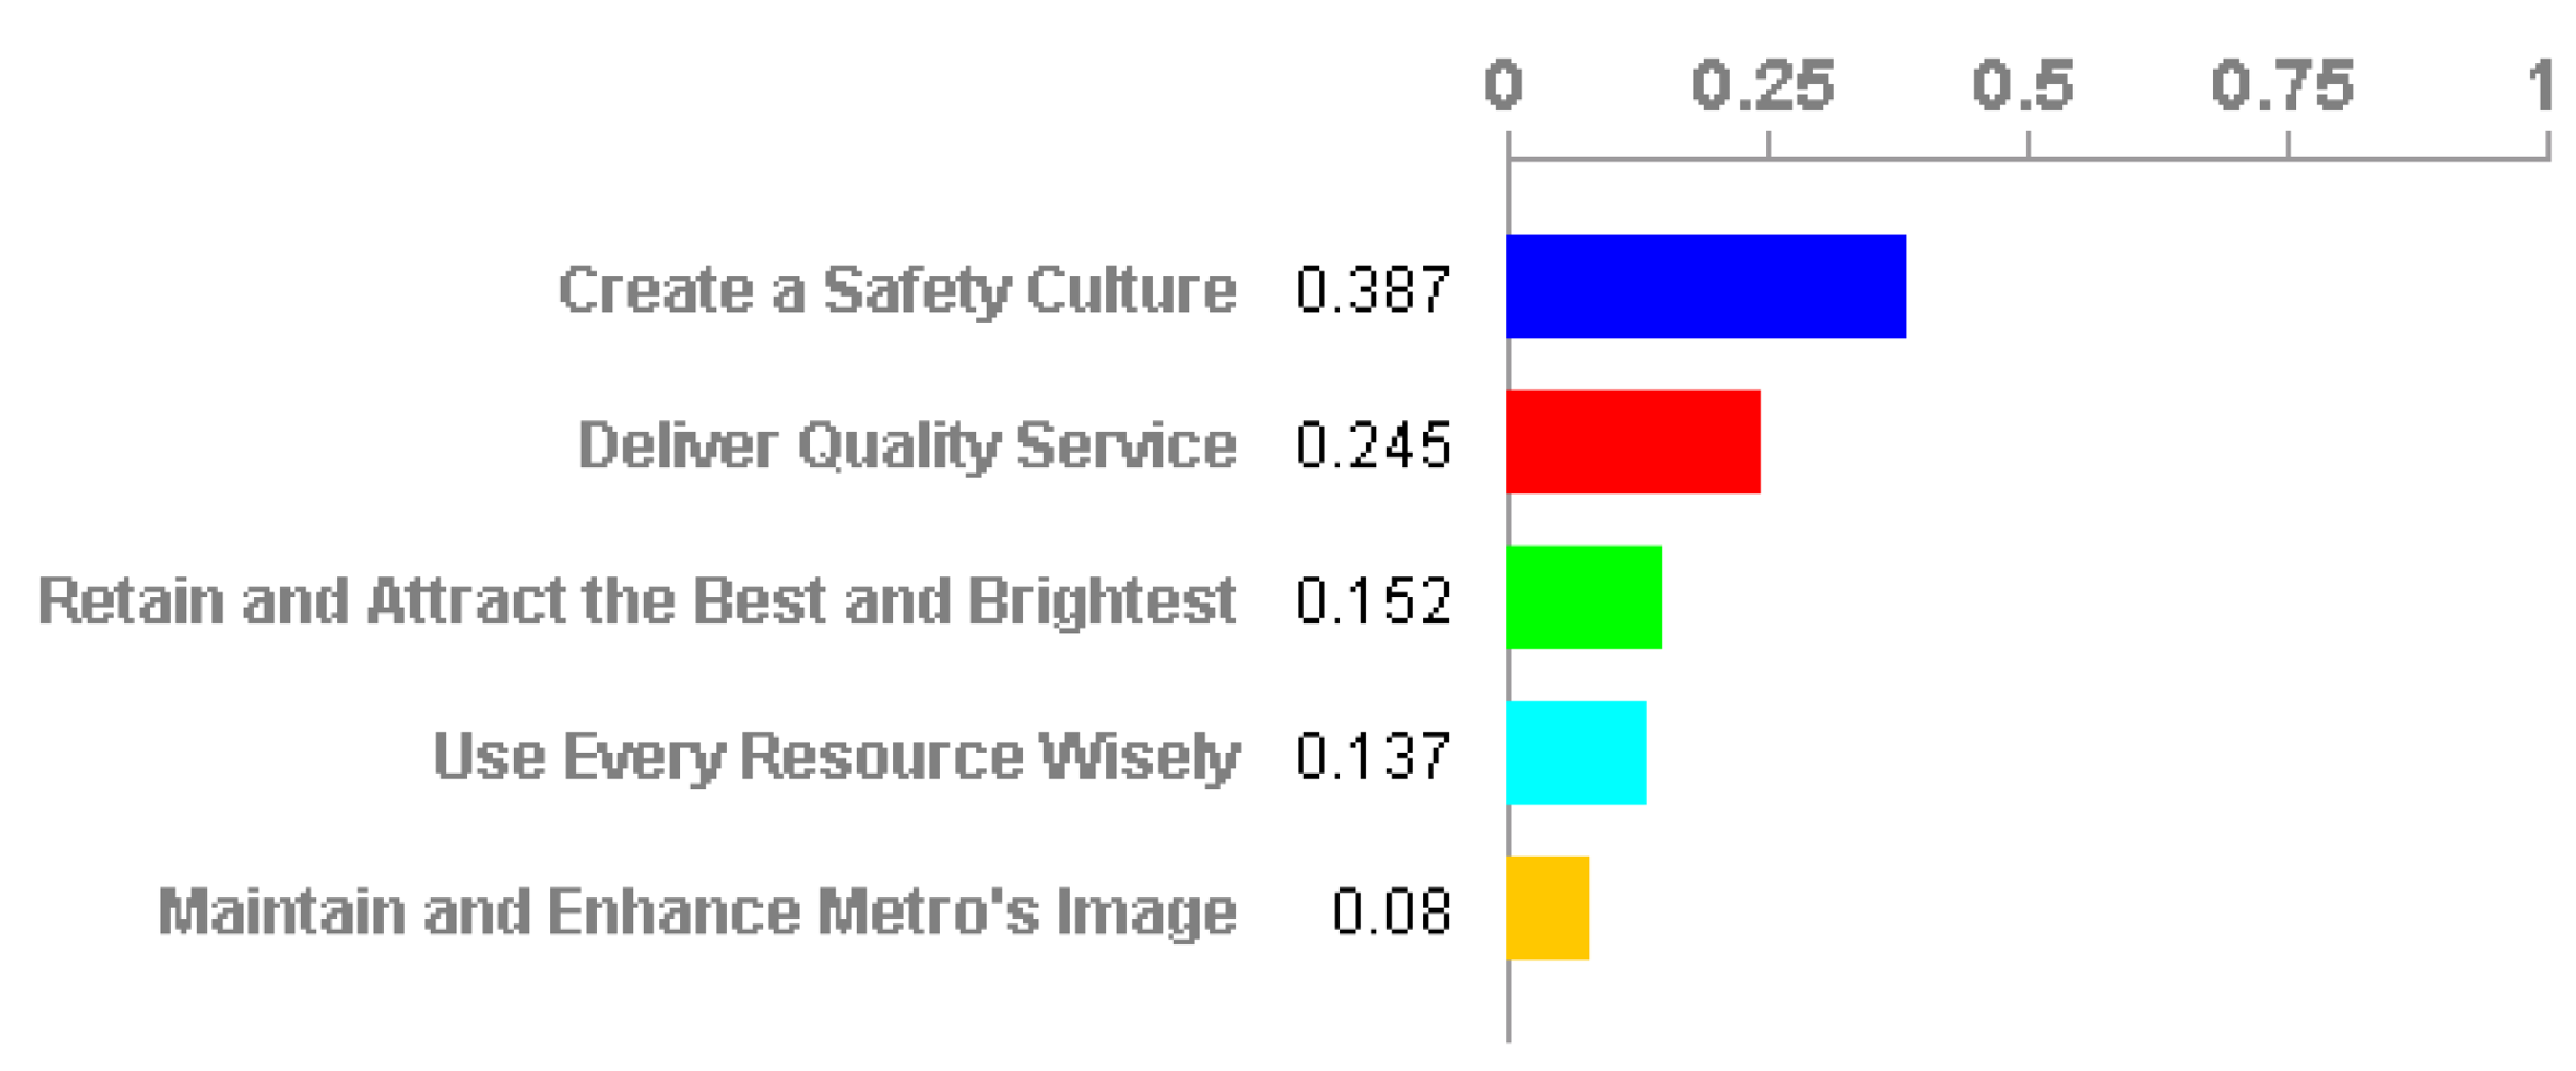
To ensure its American Recovery and Reinvestment Act of 2009 funds would address the agency’s longer-term goals, the Washington Metropolitan Area Transit Authority (WMATA) conducted a new agency-wide structured strategic capital planning process to select the most high-impact ready-to-go projects for stimulus funding. A strategic prioritization approach was necessary because WMATA identified $530 million in capital needs that were eligible for the $202 million ARRA funds the agency received. WMATA prioritized the $530 million list of potential projects in a process grounded in the agency’s five strategic goals: create a safety culture, deliver quality service, use every resource wisely, retain and attract the best and the brightest, and maintain and enhance WMATA’s image.
A key step in the selection of stimulus projects was the weighting of the agency’s five strategic goals. To accomplish this, the WMATA planning staff facilitated a discussion with the executive leadership team where, as a group, the executives walked through each goal, making the case for why a particular goal should be weighted higher than another. The result of the facilitated workshop was a set of weights that were later used to calculate a score for each project (Figure 3-13). The project score represented its role in achieving WMATA’s strategic goals. The score calculation was based on the goal weight and how significantly each potential ARRA project contributed to each strategic objective (critical, very important, important, marginal or no contribution). The open dialogue about the goal weights not only created the structure to identify ARRA projects, but it also increased executive buy-in to the overall project selection process. In addition, WMATA was able to communicate to the Board of Directors the relationship between the selected ARRA project and its contribution to agency goals.
Figure 3-13: WMATA Priority Setting
Source: Federal Highway Administration27
Linkages to Other TPM Components
- Component 01: Strategic Direction
- Component 02: Target Setting
- Component 06: Reporting and Communication
Step 3.2.4 Document investment prioritization process
This step necessitates documenting the work done to complete the steps in this subcomponent. Like the document step 3.1.5 in subcomponent 3.1, this step begins with the first step and continues throughout. Documentation created here should be included in the Long Range Transportation Plan.
Accomplishments from the above implementation steps must be documented, including:
- Defined methodologies and processes for analyzing tradeoffs and prioritizing strategies
- Relationship between strategies and established goals and priorities
- Staff roles and responsibilities
- Data and analysis capabilities to analyze tradeoffs across alternative investment scenarios
- Linkages between planning documents
- How results of tradeoff analysis and strategy prioritization will be used in programming (Component 04)
- How processes will be evaluated to ensure that planning documents are easy to use and are guiding decisions clearly and efficiently into the programming process
This diagram from the Minnesota Department of Transportation (MnDOT), included in their Minnesota GO long-range plan ( https://www.dot.state.mn.us/minnesotago/index50yearvision.html), illustrates the relationships between its plans and programs. While the rest of the plan document addresses documentation of the elements listed above, this diagram is an efficient way to quickly document and display the process and flow of information involved.
Figure 3-14: MnDOT Plans and Programs
Source: Family of Plans28
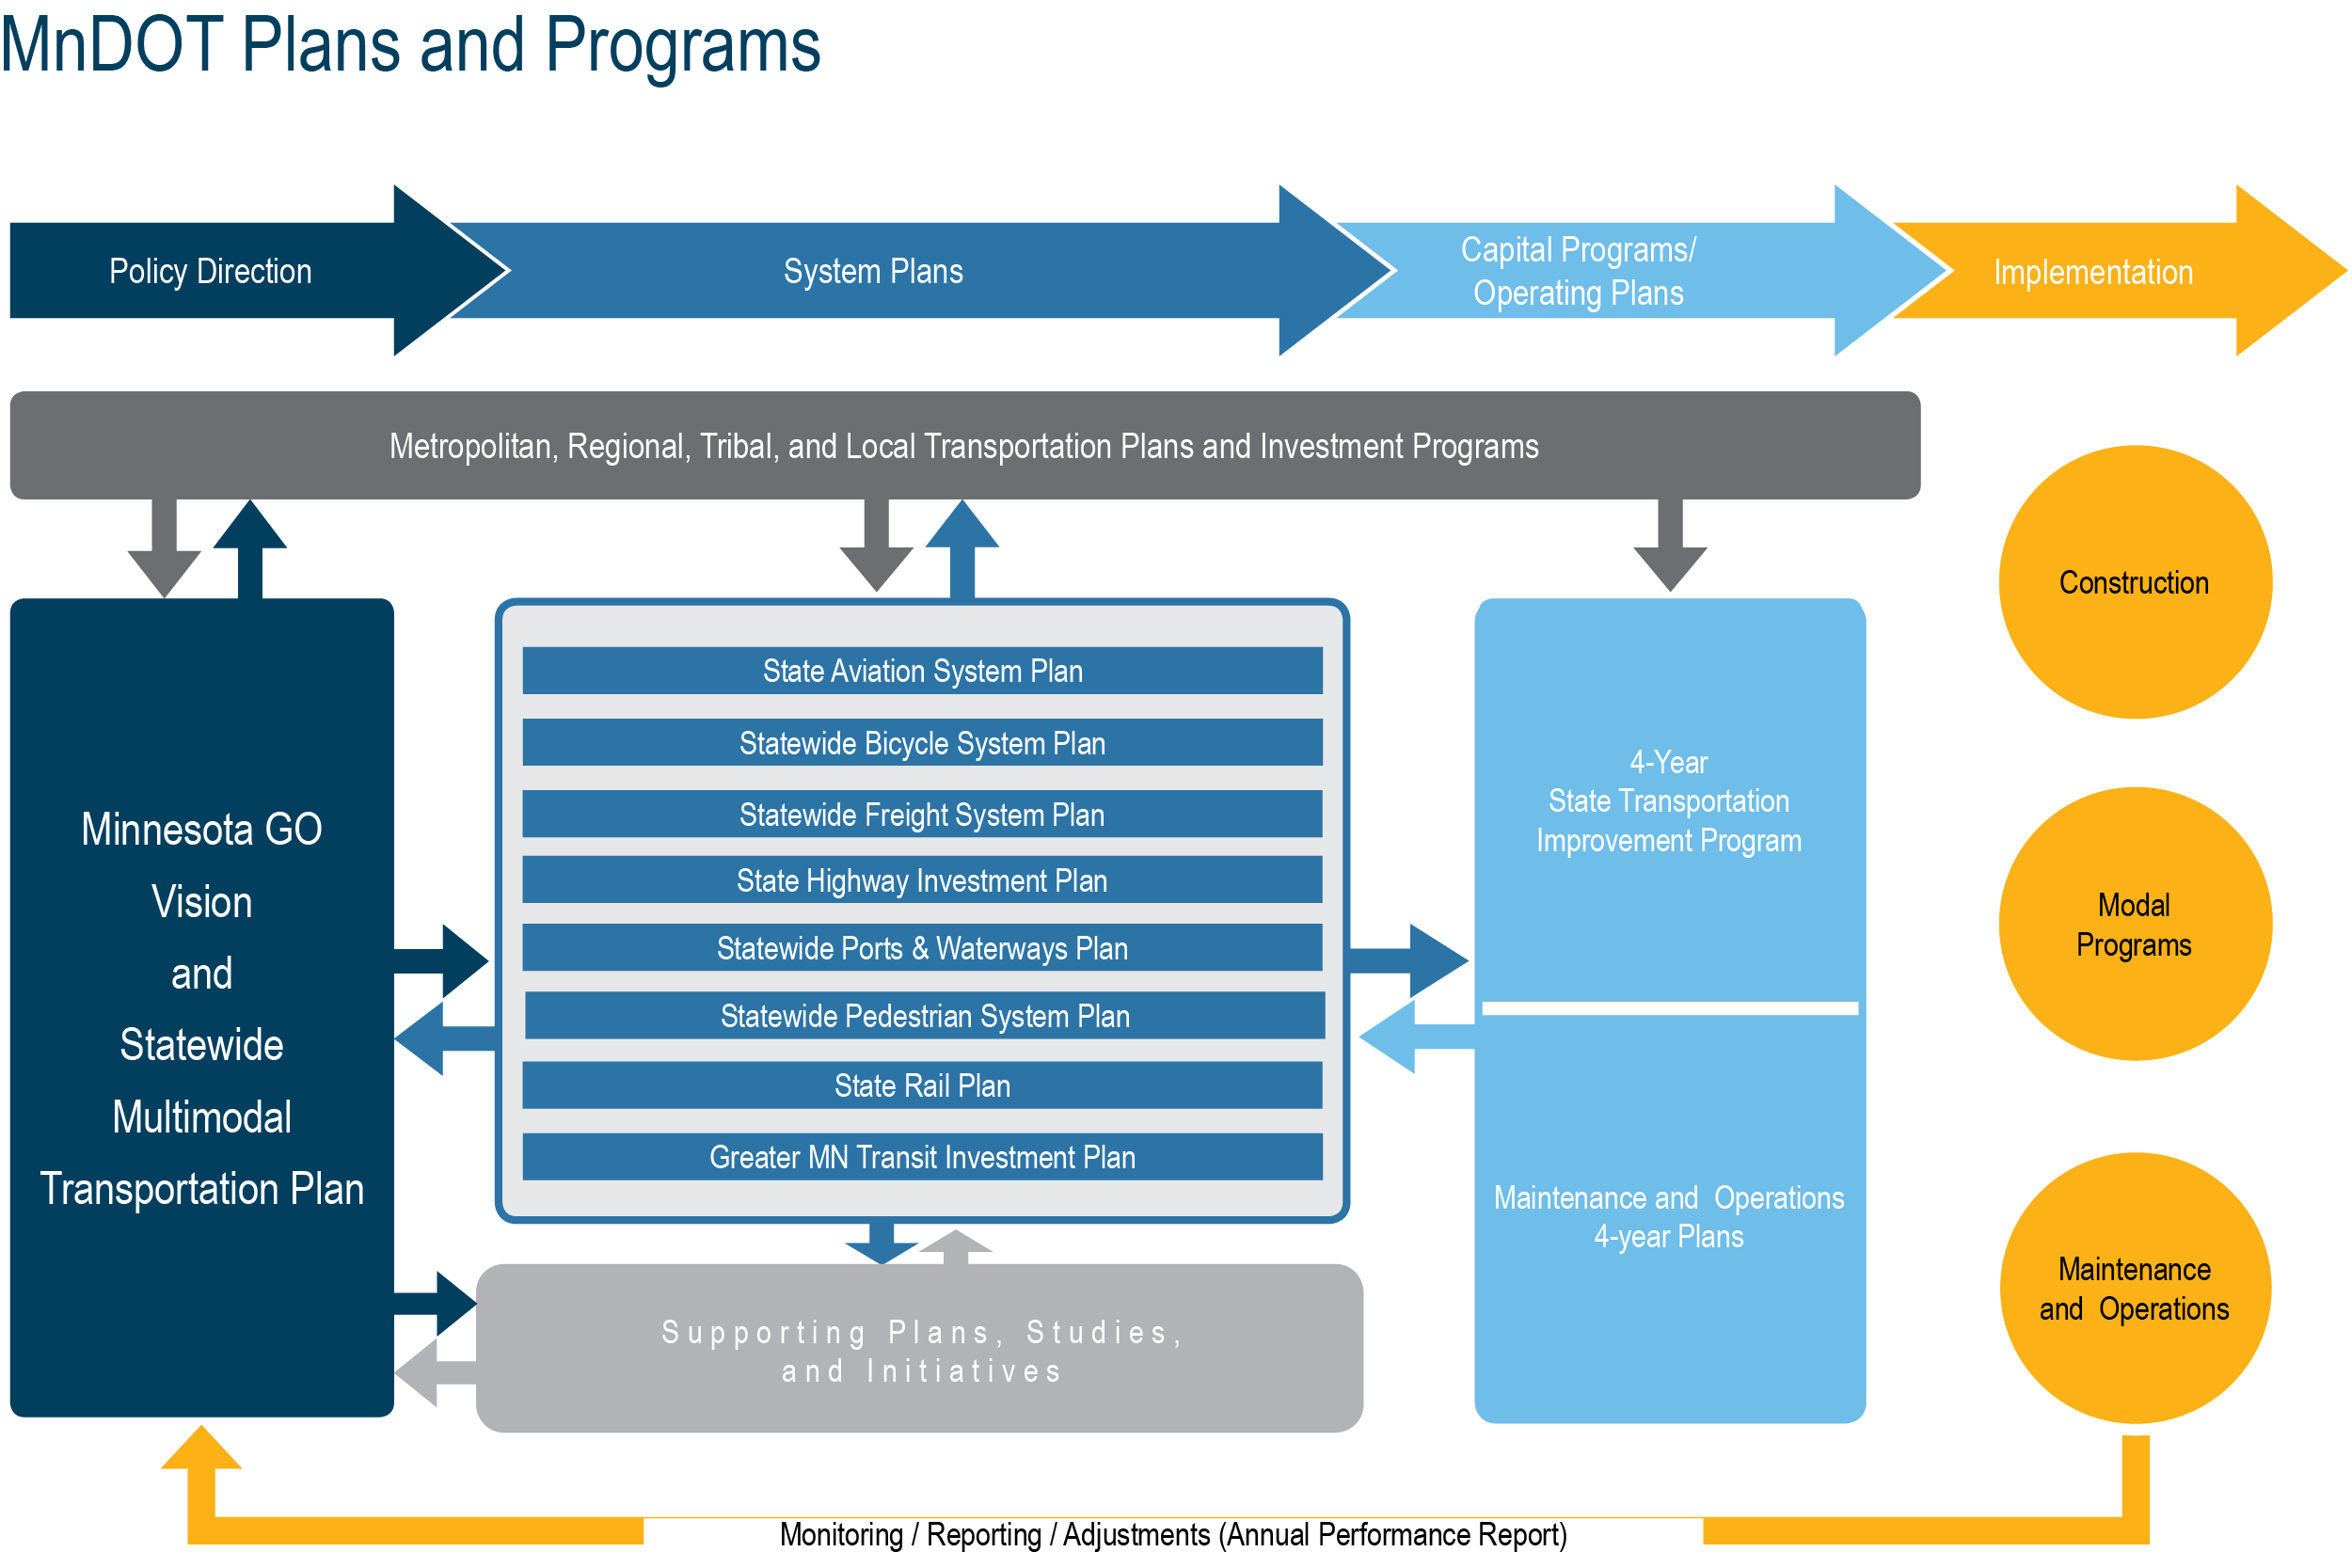
At the top, the overall process leads from policy to plan to program to implementation. Beneath this, the interrelated metro, regional, and local transportation plans are interconnected, documenting how information flows from one to another and is used in input into the LRTP at left (“Minnesota GO”). From there, the information cycles to the STIP and maintenance and operations plans. Finally, at far right, the process moves into implementation steps and then completes a feedback loop via evaluation in the next iteration of the LRTP.