Component 04
Performance-Based Programming
Implementation Steps
4.1 Programming Within Performance Areas
One facet of Performance-Based Programming is the resource allocation and prioritization processes within a performance area, such as safety, infrastructure, or mobility. The following section outlines steps agencies can follow in order to develop a program that is based on performance targets and which supports organizational goals and objectives.
- Clarify roles of internal staff and external stakeholders
- Develop project selection criteria
- Establish a formal input process to gather performance-based project information
- Document the process
“Performance information is never intended to make the decisions; rather this information is intended to inform the decision makers so the process is more focused on performance outcomes.”
Source: David Lee, Florida DOT
Step 4.1.1 Clarify roles of internal staff and external stakeholders
This step defines who is involved in the process, and when and how it will happen. A timeline for the programming process should be outlined, including when input is needed from partner agencies and other stakeholders. Goals, objectives, targets, and performance measures should be reviewed with stakeholders and strongly leveraged by senior management to ensure all involved have an understanding of these guiding elements that shape the program. Individuals should also be very familiar with the performance-based plans developed in the Performance-Based Planning process (Component 03), which build from goals, objectives, and targets to shape the programming of projects. Discussion with partner agencies should also confirm regional priorities.
Examples
Arizona Department of Transportation (ADOT) has established their P2P initiative to link planning to programming within the agency.17
This program is aimed to:
- Develop a transparent, defensible, logical, reproducible process for programming improvements
- Link planning to programming to use funds more effectively
- Drive investment decision-making with system performance
- Simplify program structure
- Implement a risk-based approach
- Assist with MAP-21 implementation
This approach is reflected in ADOT’s organization of the process in its timeline and staff and stakeholder role outline. The agency demonstrates the alignment of who, what, and when in the agency’s annual program update, as seen below. The spiral schedule gives a month-by-month representation of what group is working on which piece of the process. For example, the month pictured below is the final one of the process timeline, and highlights that at this time the State Transportation Board will be working toward approval of the program. As the final month, it also displays “the who, what, and when” for the preceding months of the full three-year update agenda. This has assisted ADOT in keeping all the pieces aligned, as the agency works on new MAP-21 required plans while also updating the LRTP and drawing on this to build the updated 10-year program.
Figure 4-5: AZDOT P2P Initiative Process
Source: Linking Planning and Programming: New Direction for Investment Decisions18
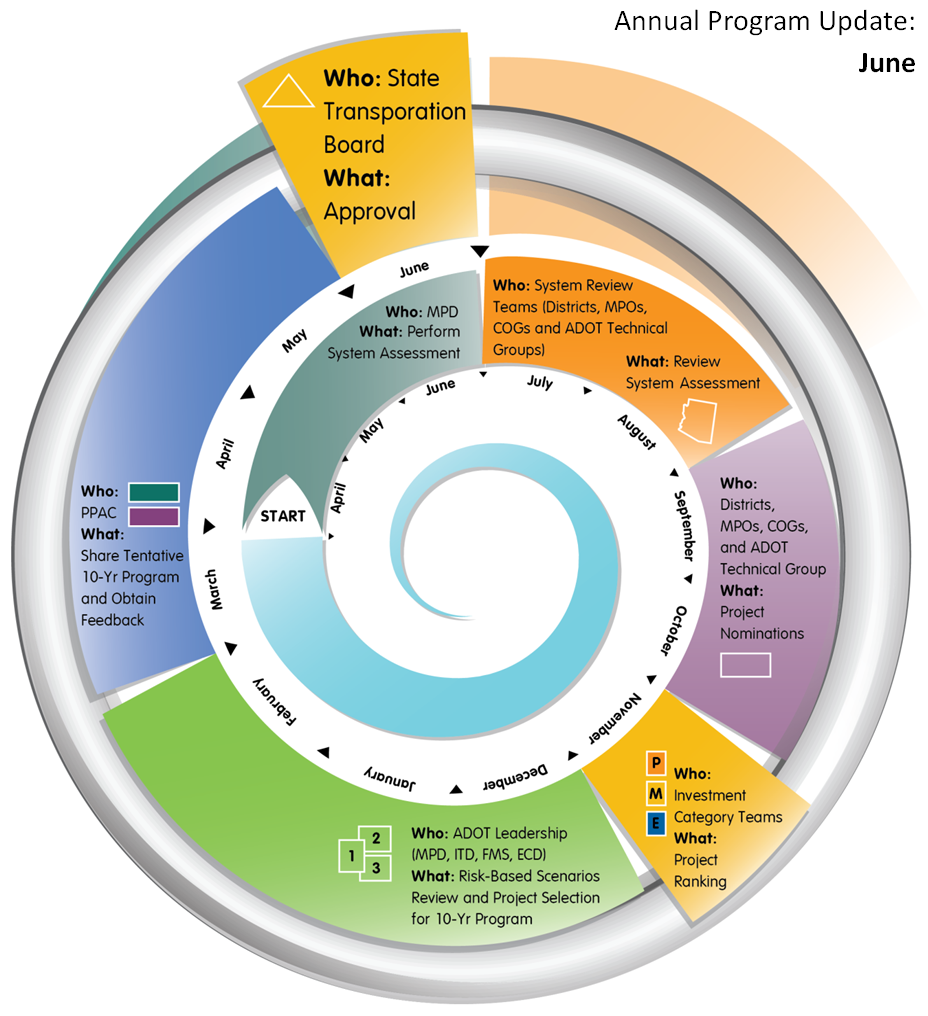
Whether presented in a more complex graphical format, as ADOT has done, or having an assignment list and timeline simply laid out as a reference will be vital to guide the process.
Linkages to Other TPM Components
- Component 01: Strategic Direction
- Component 06: Reporting and Communication
- Component A: Organization and Culture
Step 4.1.2 Develop project selection criteria
Criteria based on agency goals and objectives must be established to guide project selection. This must be understood and supported broadly by stakeholders and be reflective of regional priorities. In addition, the specific sources for the criteria must be reviewed and discussed together, so that criteria reflect priorities in all planning documents. These source documents include the MPO LRTP, state LRTP, asset management plans, transit development plans, local government plans, freight plans, and others.
Within these documents there may also be a discussion of risks that should be extrapolated from the priority level within the plans to the project-specific level for the program. As discussed in Performance-Based Planning (Component 03), risk is the positive or negative impact of uncertainty on a process or project. Risks may be positive or negative and generally can be defined as hazard, financial, operational, or strategic risks.19 Since all risks have financial implications, these must be understood as a variable when considering outcomes based on funding scenarios. As an example, Washington State provides a series of guidelines as to how to incorporate risk into project planning and programming with its Project Risk Management Guide.
This guide established a comprehensive process for incorporating risk management into agency processes, including certain requirements to be met depending on project size. A Risk Management program helps agencies expect the unexpected and anticipate additional costs or shifting project budgets as accurately as possible.
Examples
The Pikes Peak Area Council of Governments (PPACG), the MPO for the Colorado Springs, Colorado region, developed a clear set of criteria in its Moving Forward Update 2035, featured as one of FHWA’s case studies in its A Guide for Incorporating Performance-Based Planning (2014).
PPACG established a set of evaluation criteria based on its goals and objectives to assess all projects under consideration. The agency assigned one evaluation criterion for each goal, which resulted in a large number of criteria. This is a common situation in any process seeking to gather criteria from a large array of sources and stakeholders. In order to properly align the criteria, PPACG created a weighting system to reflect and credit the relative importance of each criterion for the transportation system. A ranking exercise with the Transportation and the Community Advisory Committees and a phone survey from the public resulted in an average ranking for each criterion that was adopted by the MPO Board. The result was that PPACG was able to maintain all 17 of the criteria matched to 17 goals, while also very clearly ranking those goals, making the tradeoff process much more straightforward.
Source: Model Long-Range Transportation Plans: A Guide for Incorporating Performance-Based Planning (2014)20
| Goal | Evaluation Criteria | E.C. Weight Value (Rank) |
|---|---|---|
| 1. Maintain or improve current transportation system infrastructure. | Transportation System Condition Preservation and Rehabilitation | 9.5 (1) |
Linkages to Other TPM Components
Step 4.1.3 Establish a formal input process to gather performance-based project information
This step allows specific projects to be assessed relative to the criteria developed in the previous step. Gathering this information enables the agency to track the anticipated effects of projects after their completion, and thus evaluate their impact on the attainment of performance targets and goals. This will provide an answer as to how investments in specific projects also lead toward those targets and goals, enabling an agency to track the flow of money and the efficacy of its impacts. This means that after project completion, the agency will be able to further justify or reexamine the allocation of monies and how programming decisions were made. The input process will build a simple database of project characteristics such as location, start/stop dates, owner, justification, and project description and outcome.
Examples
At the Mid-America Regional Council (MARC), the metropolitan planning organization (MPO) for the greater Kansas City area, an online template library was developed to gather calls for projects for programming efforts.
Figure 4-6: MARC Project Templates
Source: MARC Transportation Department21
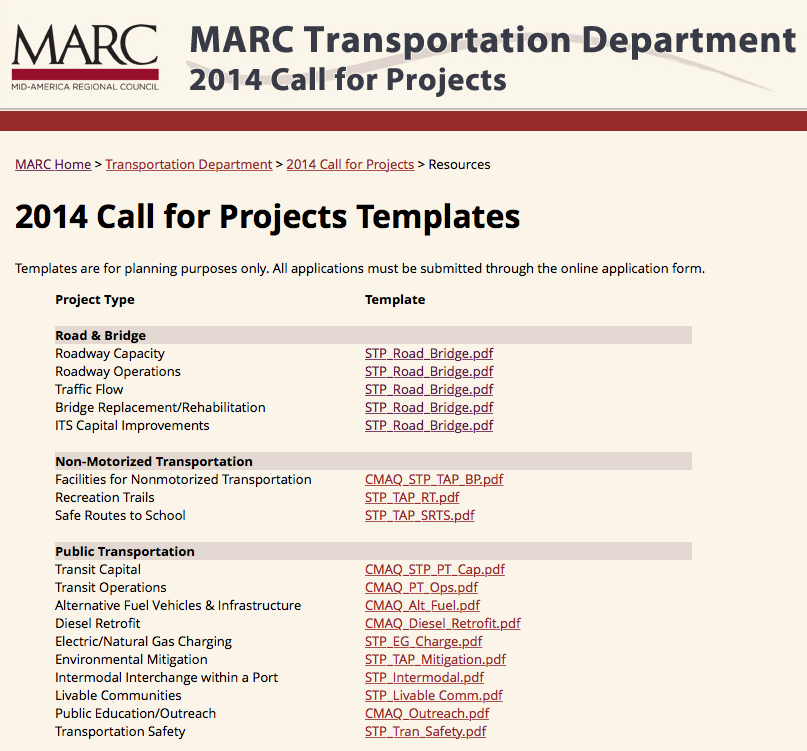
The Transportation Outlook 2040 LRTP and accompanying TIP included both fiscally constrained and unconstrained project lists, demonstrating how a large number of projects can be narrowed down using a strong set of criteria to match projects with prioritized goal areas, and then constrain them within the range of available funding. The online call for projects page is currently in use for multiple plans, including MARC’s Surface Transportation Program, 2017-2018, Transportation Alternatives (TAP), 2014-2018, and Congestion Mitigation and Air Quality Improvement Program 2015-2018.
The input uses a menu to gather basic information on the project such as program, location, need, modes, description, usage, and relationship to or inclusion in a number of other plans. This allows MARC to receive a large amount of information from a large number of users while simultaneously organizing it into a database-friendly format that will assist in building a prioritized project list. More information is available here.
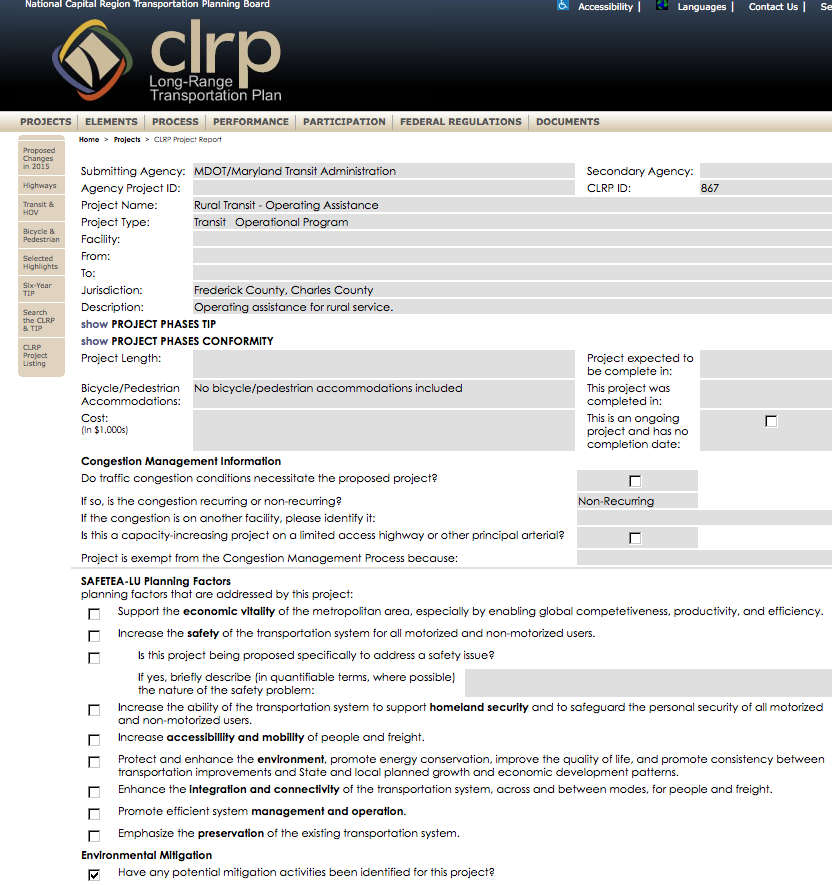
The National Capital Region Transportation Planning Board has a similar online interface that allows project input. In this example, the Maryland Transit Administration (within the Maryland Department of Transportation (MDOT)) has submitted a project report for Rural Transit Operating Assistance.
Figure 4-7: CLRP Online Interface
Source: CLRP: Long Range Transportation Plan22
Linkages to Other TPM Components
- Component 01: Strategic Direction
- Component 06: Reporting and Communication
- Component A: Organization and Culture
- Component B: External Collaboration and Coordination
Step 4.1.4 Document the process
The performance-based programming process must be documented in a manner that ensures transparency and accountability and makes clear how and why projects were chosen for the program. This is one of the major tenets of TPM: ensuring that decisions are based on performance outcomes and making this clear throughout the process. This strengthens the key link back to goals, objectives, and targets. This documentation becomes a vital part of the STIP or TIP. In addition to documenting the process for arriving at that document, further narrative should be included about how the agency will continue to refine the methodology for programming moving forward and how the efficacy of investments will be evaluated.
This documentation is vital not only for inclusion in the final programming document, but also for use in Monitoring and Adjustment (Component 05), which evaluates the efficacy of the overall process of allocating resources toward achieving strategic goals; and Reporting and Communication (Component 06), which enhances internal external understanding of performance results.
Examples
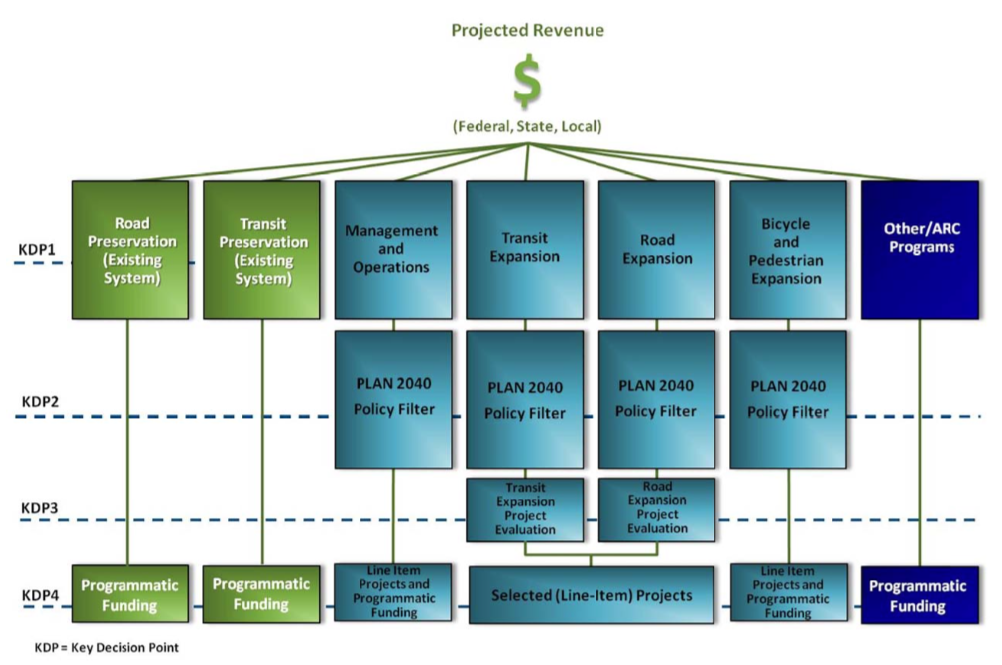
The Atlanta Regional Commission (ARC) provides an illustration of documenting the programming process in this figure on project selection from its PLAN 2040 Regional Transportation Plan.
This figure illustrates where and how funding is allocated. It provides a quick reference to key decision points (KDP) where input is needed to shape project selection.
It also can be a sort of menu, showing the many areas in need of funding that must be balanced. The first row represents the general program area and colors indicate performance areas, with system preservation in green, congestion/mobility in blue, and other in dark blue. Projects are then divided into the appropriate plans and programs with increasing detail, leading to KDP 4 where the program is finalized for each project type. For more, visit the Plan 2040 site at https://www.atlantaregional.com/transportation/regional-transportation-plan/rtp-chapters-and-appendices.
Figure 4-8: Atlanta Regional Commission Plan 2040 Funding Allocation
Source: Atlanta Regional Commission PLAN 204023
Linkages to Other TPM Components
4.2 Programming Across Performance Areas
Performance-Based Programming also addresses allocation and prioritization processes across performance areas. As discussed in the Introduction, though this is an emerging practice, some agencies have well-developed frameworks for this process. Implementation steps are:
- Identify and assign internal roles and responsibilities
- Clarify purpose of cross performance area prioritization
- Develop a methodology that reflects agency priorities and external stakeholder interests
- Document the process
Although not specified as a step, Programming Across Performance Areas requires development of project selection criteria similar to Programming Within Performance Areas (refer to step 4.1.2 “Develop project selection criteria”).
“The ability to apply the framework…depends on an agency’s organization structure and maturity with respect to performance-based planning, asset management, needs identification, and performance management.”
Source: NCHRP Report 806, Cross-Asset Resource Allocation
Step 4.2.1 Identify and assign internal roles and responsibilities
Because across performance area programming is not yet common practice, it is critical for the agency to clearly define roles and responsibilities for completing the process. Adjustments to the way programming has previously been done will likely encounter resistance for a number of reasons, including worries over the potential for reduced allocations on the part of particular performance area staff, concern over increased workloads due to project submission and scoring, and skepticism about the assessment tool/methodology to be employed. These are all valid concerns, and should be addressed openly from the beginning to ensure support among staff. To establish a process that will be used on a continuing basis to drive investments, staff must feel that the new way of doing things is useful, worth any extra work required, is responsive to their input, and respects existing processes.
It is also important that senior managers and executives express support for this initiative. While establishing an inclusive process will bring some staff on board, some will remain resistant. Executive support will ensure this group continues to support the effort even while they are not convinced of its merits.
Roles to define include:
- Project curator – who will facilitate project submissions?
- Criteria selection team – who will develop criteria by which projects will be evaluated for inclusion in the STIP or TIP?
- Data reporters – who is responsible for reporting data that will be used to assess projects?
- Analysts—who will evaluate the potential projects based on the criteria? Determination of what methodology will be used?
- Decision maker—who will finalize and approve the selection of projects?
- Liaison – who will communicate progress to the agency as a whole and gather feedback from those not intimately involved in process development?
Examples
House Bill 2 in Virginia directs the Commonwealth to establish an objective process to score projects for funding to ensure that the budget allocation process is transparent to the public and that the most strategic projects are chosen. The Commonwealth Transportation Board (CTB) is an 18-member group including district representatives, the Secretary of Transportation, the Director of the Department of Rail and Public Transportation, and the Director of the Department of Transportation. The CTB allocates funding to specific projects for all transportation projects in the state; because of HB2, the Board will now use an objective project scoring system to program projects.
The HB2 Implementation Policy Guide24 documents eligible projects and the scoring process; it also defines roles and responsibilities:
Source: HB2 Implementation Policy Guide25
| Group | Roles and Responsibilities |
|---|---|
| Commonwealth Transportation Board |
|
| Office of the Secretary of Transportation |
|
| Technical Evaluation Team |
|
| External Peer Review |
|
Massachusetts Department of Transportation
Section 11 of Chapter 46 of the Acts of 2013 established a Project Selection and Advisory Council (the Council) charged with developing uniform project selection criteria.26 The Council is comprised of representatives from key external stakeholders such as MPOs, RTAs, municipalities, advocacy organizations, and others. The mission of the Council states:
“With due consideration of the requirements of fiscal constraint, federal funding restrictions, regional priorities, geographic equity, environmental justice and state of good repair, and in a manner that balances the need for responsive and transparent adaptability to unanticipated changes in funding, project readiness or in the event of an emergency or public safety need, the Project Selection Advisory Council, as established by the Massachusetts Legislature in Section 11 of Chapter 46 of the Acts of 2013, seeks to review existing statewide project evaluation criteria and prioritization processes for Massachusetts’ multi-modal transportation system. The PSA Council will recommend changes for a more uniform, transparent and data-driven prioritization process that reflects MassDOT’s mission to provide our nation’s safest and most reliable transportation system to strengthen our economy and quality of life across the Commonwealth.”
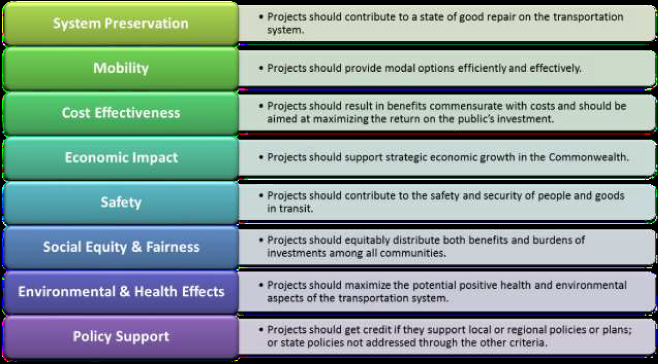
Over an 18-month period, the Council met regularly and consulted with the public and legislature. On July 1, 2015, “Recommendations for MassDOT Project Selection Criteria” was delivered, focusing primarily on modernization and capacity projects. The project selection criteria defined in this effort is illustrated below.
Figure 4-9: MassDOT Project Selection Criteria
Source: Recommendations for MassDOT Project Selection Criteria27
Maryland Transit Administration
The Maryland Transit Administration (MTA) is one of the modal administrations within the Maryland Department of Transportation and has developed an in-house Excel-based spreadsheet tool to prioritize projects across performance areas. The Programming Office within MTA requests project submissions from across the agency, and then distributes the list of projects to seven Deputy Chiefs, along with senior staff representing operations, engineering, administrative support, planning, and safety. Each Deputy Chief initially ranks each project on a one to three scale based on the perspective of their performance area and then the group meets to discuss variations in the assessments. Once scoring is complete, projects are entered into the decision matrix tool and results are provided to agency leadership to assist in making funding decisions.
Linkages to Other TPM Components
Step 4.2.2 Clarify purpose of cross performance area prioritization
Agencies take different approaches to cross performance area programming based on particular circumstances. In some agencies with more developed project selection and funding allocation, methodologies for specific performance areas may decide that such projects will not be subject to cross-area prioritization because the process is data driven and is producing good results. However, if an agency finds that it is not achieving desired results under its current regimen, this should be reconsidered. Other agencies may want to include all projects regardless of how data-driven later programming is.
Whichever approach is chosen, it must be clearly documented which project types will and will not be evaluated using this process. The purpose of the prioritization should be stated and clearly communicated to all involved, including any agencies that will submit a project for funding.
In addition, the agency should clearly document why this new approach is necessary, for example:
- Virginia Department of Transportation:
- Increase transparency and accountability for project selection and to make the process objective
- Improve stability in the Six-Year Improvement Program
- MassDOT:
- Invest in transportation needs to build public confidence
- Maximize return on investment in terms of traditional economic ROI but also in terms of quality of life and sustainability
- Address significant backlog
- Deal with acute funding constraints
- NCDOT:
- Increase transparency of process
- Remove politics from transportation decision-making (strong public desire)
- Maryland Transit Administration:
- Provide a common set of performance-based criteria to asses a range of assets (e.g., vehicles, infrastructure, stations, maintenance facilities)
- Reflect political and legal mandates while also highlighting MTA’s strategic direction (e.g., exceptional customer service)
- Delaware Valley Regional Planning Commission
- Apply universal criteria that can evaluate a variety of modes (roadway, transit, bike, pedestrian and freight) to provide the means to effectively balance programming of the region’s needs and resources.
Once the universe of eligible projects has been determined and the purpose of the cross-area prioritization has been determined, the agency must determine how projects will be evaluated. Project selection criteria based on particular measures will help an agency achieve an objective, data-driven process. Using existing data will be most expedient, but additional measures can be added or substituted in future iterations of project scoring. Refer to step 4.1.2 “Develop project selection criteria” for further information.
Examples
The Massachusetts Department of Transportation developed a project prioritization framework for cross-asset allocation. The group in charge of developing this policy debated at length over what project types would be subject to prioritization, determining that two project categories (Modernization and Capacity) would be included. Asset management and basic state of good repair projects would not be included if they underwent rigorous prioritization within the asset silo. Asset management projects not subject to this sort of review would be included in the new prioritization process. The graphic below demonstrates this point. Blue boxes show projects to be included in the prioritization process and explain the rationale behind this decision.
Figure 4-10: MassDOT Prioritization Process
Source: Recommendations for MassDOT Project Selection Criteria28
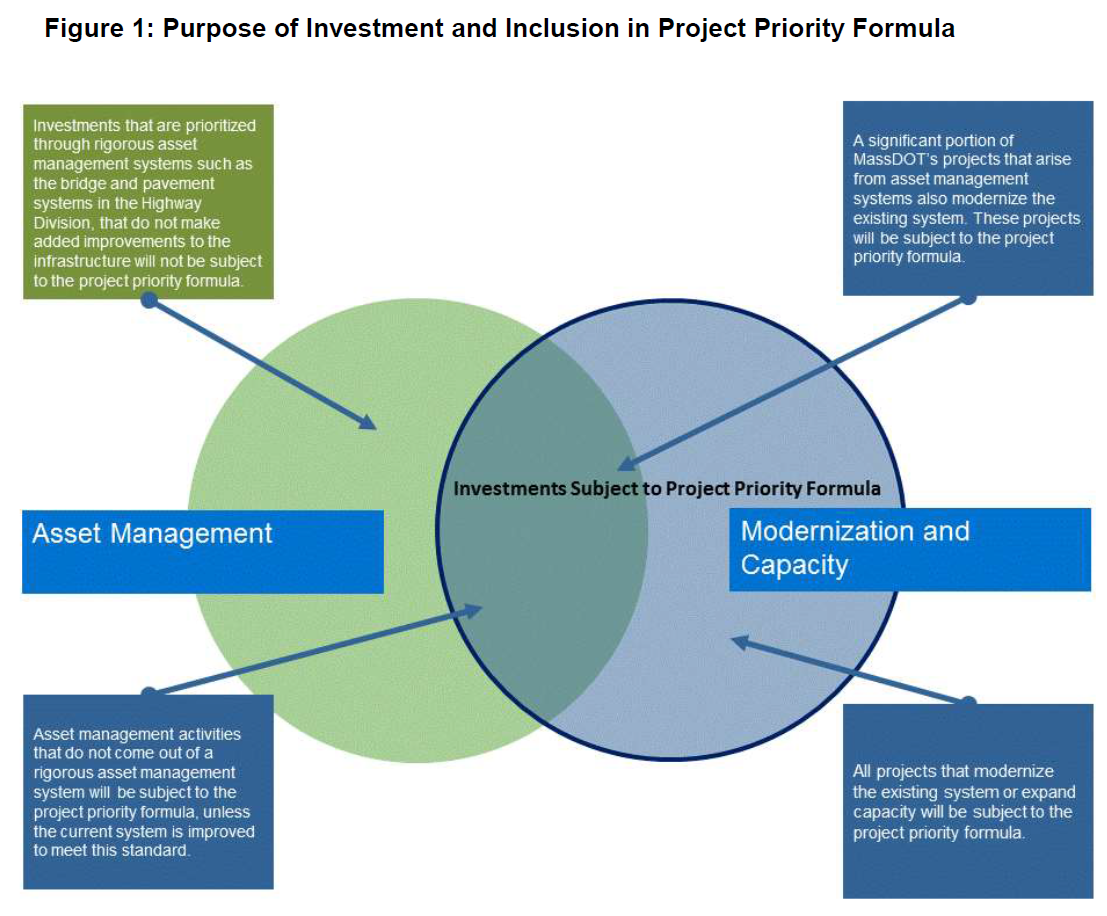
MassDOT chose to exclude basic asset management projects from project prioritization because many of these projects have straightforward scopes and predictable impacts on performance, making comparison to other projects less useful. However, the agency does acknowledge that there is a need to prioritize these projects in some way because funding consistently falls short of need. To this end, the agency decided that mature asset management systems would continue to be used as-is to prioritize projects (green box). Those projects that go beyond asset management to modernize or add capacity are subject to prioritization through this new system (blue boxes on right).29
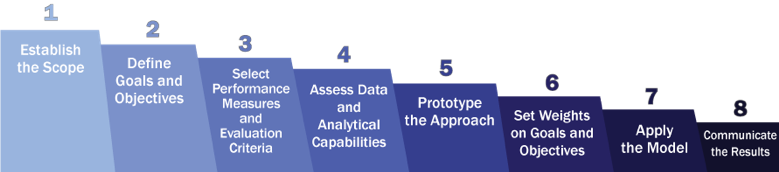
In this step a methodology is developed that reflects the goals of the agency and its stakeholders. Prior to performing this step the agency should have already spelled out its priorities by establishing goals in the Strategic Direction (Component 01). Now the agency goes further, and prioritizes candidate investments based on the degree to which they support the agency’s goals. To perform this step the agency should determine how different performance measures relate to agency goals, and how specifically the data on the performance of a given investment should be used to prioritize. Input from external stakeholders is important to ensure that the priorities established internally by agency staff match as much as possible to areas where partner agencies and the public desire improved performance. An agency should seek to gather input on the overall prioritization approach, as well as on the evaluation of specific investments that are prioritized using the approach. Formal methods for performing this step fall in the domain of Multi-Objective Decision Analysis (MODA), also referred to as Multi-Criteria Decision Making (MCDM). Fundamental concepts regarding how to structure a multi-objective prioritization problem are discussed in Keeney and Raiffa’s Decisions with Multiple Objectives: Preferences and Value Tradeoffs. NCHRP Report 806, Cross-Asset Resource Allocation and the Impact on System Performance presents a framework for applying MODA to optimizing cross-asset, multi-objective investments in transportation. NCHRP Report 921, Case Studies in Implementing Cross-Asset, Multi-Objective Resource Allocation updates the NCHRP Report 806 framework, describes a set of case studies, provides supplemental implementation guidance, and documents spreadsheet and web tools for transportation agency use. Figure 4-11, reproduced from NCHRP Report 921, details a process for implementing a multi-objective prioritization approach. Items 3 to 7 of the process are performed in this step. These include the following: Figure 4-11: Process for Implementing a Multi-Objective Prioritization Approach Source: NCHRP Report 921 Select Performance Measures and Evaluation Criteria: for each of the agency’s objectives identify one or more performance measures that will be used to quantify progress. Wherever possible, measures should be quantitative rather than qualitative. Also, it is important to structure measures such that they scale appropriately based on project size. Once measures are selected the agency should determine how they should be used to calculate a score or utility function for each objective. A common approach is to convert measures into a 0-1 score (0% to 100%) where 0 represents the lowest level of achievement and 1 represents the highest. Alternatively, measures can be scaled such that they are analogous to economic benefits, or dollars. Assess Data and Analytical Capabilities: determine what data and systems are available for predicting the performance of each of the candidate investments being prioritized. Often a mix of direct measurements, predictive models, representative default values and subjective judgements are used to characterize the performance of candidate investments. One possible outcome of the assessment is that the agency must revisit the analysis scope and measures, and/or collect more data. Prototype the Approach: next it is recommended that the agency test the prioritization approach to evaluate the feasibility of the approach, the degree to which the results reflect the agency’s goals for implementing a structured prioritization process, and the systems the agency will need to support the approach. Prototyping the approach requires collecting data for a sample set of projects, calculating a score or utility for each project, prioritizing the sample set, and then reviewing and assessing the results. Often an initial test can be performed using a spreadsheet or one of the prototype tools detailed in NCHRP Report 921. Prototyping the approach may result in further changes to the approach based on the outcomes of the prototyping. Set Weights on Goals and Objectives: once the prioritization process is firmly established, and before it is put into practice, the agency should set weights on any qualitatively-determined prioritization factors. For instance, often the prioritization process results in a 0-1 score for each objective. An overall score is then obtained by multiplying the score for each objective by a weight and summing the weighted scores. Where such an approach is used the specific weights used for each objective can be determined using the Analytical Hierarchy Process (AHP). This process relies on pairwise comparison of each objective to calculate a weight. Alternatively, the agency may use the Delphi process to reach consensus on the set of weights to use. Note that depending on the specific prioritization approach, it may or may not be necessary to set explicit weights. If the process involves converting all measures to monetary equivalents or utilizes a nonparametric approach such as Data Envelopment Analysis (DEA) then setting weights on each objective is unnecessary. Apply the Model: finally, the approach is used to prioritize across program areas. This involves identifying candidate investments consistent with the scope established in Step 4.2.2., calculating measures for each candidate, and prioritizing using the weights determined as described above. Typically, the priorities established are used to inform the decision-making process, but the final decision concerning what investments to pursue is made considering additional factors not formally addressed in the analysis. For instance, often a structured prioritization process assumes a single budget constraint, as well as a single-period decision. In reality, transportation agencies pay for investments over a period of multiple funding periods and may need to consider a number of complex funding program rules. Also, it may be difficult to incorporate all of the factors that motivate a given investment into a structured process, particularly regarding issues such as risk, criticality, and equity. An additional tradeoff analysis, in which results are generated assuming a range of different budget constraints, can help illustrate performance impacts resulting from varying funding levels and provide additional insights to agencies as they finalize their investment decisions. “This is not a mechanical process – scores influence decisions but do not dictate them. If the project has a high score, an agency is not forced to fund it. However, if a project has a low score and an agency wants to fund it, than the sponsor needs to come up with a solid justification.” Source: Ron Achelpohl, Mid-America Regional Council Note: prototype tools for supporting the process described above are described in NCHRP Report 921. AASHTO is maintaining the web tool developed through this research. This tool is available at http://multiobjective.org/. Maryland Department of Transportation (MDOT) The Maryland Open Transportation Investment Decision Act – Application and Evaluation30 enacted in 2017 requires MDOT to rank major capital transportation projects considering a set of 23 measures organized into nine goals. As described in NCHRP Report 921, MDOT formed a cross-functional team of MDOT staff and local partners to help implement the law. MDOT conducted a series of workshop to determine evaluation criteria for each of the 23 measures. In some case the measures are determined through direct measurement, while in other the measures are estimated through predictive models (e.g., travel demand forecast) or based on expert judgement. Scores for each measure are converted to a 0-1 scale and combined to calculate 0-1 scores for each goal. In the final workshop MDOT used the Delphi process to establish weights on each of the nine goals. The resulting weights are shown in Figure 4-12. Figure 4-12: MDOT Weights by Goal Source: NCHRP Report 921 MDOT has used the prioritization approach to inform the selection of major capital investments annually since 2018. MDOT has published a technical guide31 detailing the prioritization approach, and developed a web site for Maryland state, county and local agencies and municipalities to use to nominate projects. North Carolina Department of Transportation The Strategic Transportation Investments Law passed in 201332 establishes the Strategic Mobility Formula, which creates a data-driven scoring method for allocating resources. The formula takes into account local input from MPOs, RPOs, and Divisions to evaluate projects after all have been given quantitative scores based on established measures related to crashes, pavement condition, travel time savings, and others. Two of three project categories (Division Needs and Regional Impact) are scored with local input according to the formula: Total = Quantitative Data + Local Input The third project category (Statewide Mobility) is based entirely on data. Each organization receives an equal number of points to distribute among the total projects under evaluation and can choose two methods:33Linkages to Other TPM Components
Step 4.2.3 Develop a methodology that reflects agency priorities and external stakeholder interests
Examples

Source: Adapted from NCDOT Strategic Planning Office Presentation34
| Method | Top 25 | Control Total |
|---|---|---|
| Description | #1 = 100 #2 = 96 #3 = 92 … #25 = 4 |
Can rank projects as desired Maximum 100 points per project Minimum 4 points per project |
By ranking the organization’s top 25 desired projects, the final list can be easily communicated to the public and other stakeholders less familiar with the project; the Control Total alternative provides an opportunity for more fine-tuning. Both methods use the same number of total points. MPO/RPO evaluation is based on the particular organization’s methodology to rank and prioritize projects internally and Divisions use knowledge of the area to assist in their ranking.
Virginia Department of Transportation
The Virginia Department of Transportation prioritized agency goals differently for different parts of the state by creating Area Typologies. The table demonstrates how goal priorities vary by Typology. The map of typologies, available here, shows what Typology applies to particular locations. This approach allows the state to focus on the most important needs in particular areas, ensuring that the most appropriate projects are selected to impact the most pressing issues of those areas.35
VDOT also created a separate category called High Priority Projects, which includes projects that address designated Corridors of Statewide Significance or Regional Networks. These are the most important projects in the state according to agency priorities.
Source: Adapted from About HB236
| Factor | Congestion Mitigation | Economic Development | Accessibility | Safety | Environmental Quality |
|---|---|---|---|---|---|
| Category A | 45% | 5% | 15% | 5% | 10% |
| Category B | 15% | 20% | 25% | 20% | 10% |
| Category C | 15% | 25% | 25% | 25% | 10% |
| Category D | 10% | 35% | 15% | 30% | 10% |
The Delaware Valley Regional Planning Commission developed nine universal criteria to evaluate projects to be added to the Transportation Improvement Program (TIP). The criteria were defined through a collaborative process with Pennsylvania and New Jersey members of a working subcommittee of the DVRPC Regional Technical Committee (RTC) and included staff from the State DOTs, transit agencies and bicycle and pedestrian representatives. The selected criteria were designed to align directly with the multimodal goals of the Connections 2040 Plan, the region’s long-range plan, and reflect the increasingly multimodal nature of the TIP.
The following characteristics were used to define the benefit criteria:
- Align with the Long-Range Plan and other regional objectives;
- Be relevant to different types of TIP projects;
- Indicate differences between projects;
- Avoid measuring the same goal(s) multiple times;
- Cover the entire nine-county region;
- Be more quantitative than qualitative;
- Use readily available data with a strong likelihood of continued availability; and
- Be simple and understandable
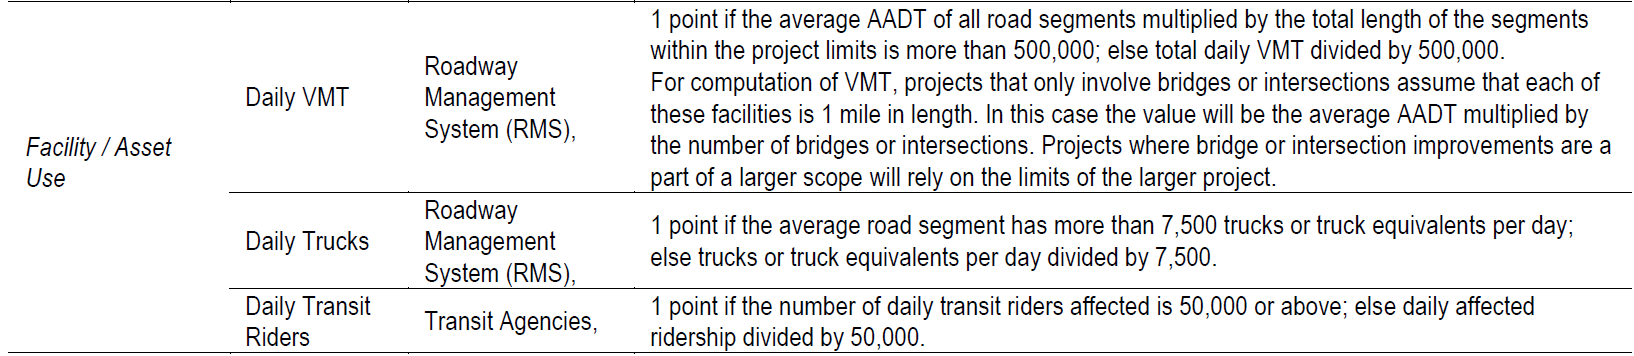
The resulting eight criteria were used to evaluate all TIP projects regardless of mode. This enabled DVRPC to uniformly communicate the benefits of the projects contained in the TIP. What was customized for the different modes was the specific measure used for each criterion. For example, below are the transit, roadway and bridge measures used for the “Facility/Asset Condition” criterion:37
Figure 4-13: DVRPC Facility and Asset Criteria
Source: FY 2015 Transportation Improvement Program, Appendix D38
After defining the “benefit criteria,” the submitting agency evaluated each project submitted to the TIP. It should be noted that the eight benefits criteria were not used to identify projects to exclude from the TIP. Instead, the criteria created a common language for each submitting agency to describe the benefits of their set of TIP projects. The criteria development process and resulting criteria were documented in the FY 2015 TIP, but the score and ranking of the TIP projects were not publicly released.
DVRPC uses the benefit criteria to communicate why these projects were necessary for the region to attain its multimodal goals.
Linkages to Other TPM Components
- Component B: External Collaboration and Coordination/a>
- Component C: Data Management
- Component D: Data Usability and Analysis
Step 4.2.4 Document the process
Documentation is a critical part of every process in this guidebook, and this remains true for cross-performance area programming. Because this process is heavily dependent on data, scoring, measures, and various priorities, it is extremely important to document. In addition, many agencies choose to implement this process as part of an effort to increase transparency related to project funding and budget allocation; without proper documentation, the process will still seem like a black box.
In addition to documenting how the process was established and conducted, the agency must document:
- Project selection criteria and how they were determined
- Formulas for project evaluation and justification behind the approach
- Why certain goal areas were prioritized
- Impacts on performance from tradeoff analyses
- What alternatives were not chosen and why
- Roles and responsibilities
- Project eligibility
- Project submission process
- Timeline for submission, evaluation, and publication of final results
- Input received from external stakeholders
- Risk factors that may impact program delivery and effectiveness
- Output targets that can be used to track anticipated effects of projects
Examples
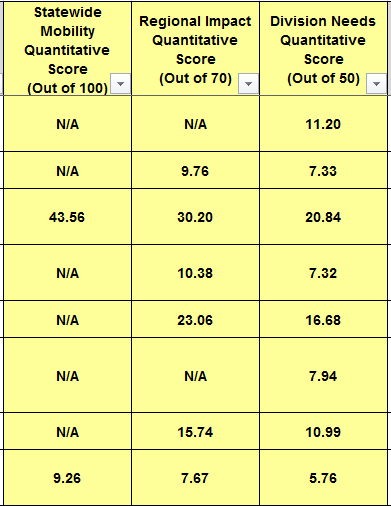
The North Carolina DOT publicly documents scores given to each project evaluated through the cross-area performance prioritization process. The image below is a very small portion of the file posted online. The Excel files are available for download and include project information, cost, and evaluative scores by partner agencies as well as the quantitative scores given by NCDOT. Making this wealth of information available goes a long way toward increasing transparency of the programming process.
Figure 4-14: NCDOT Prioritization Scoring
Source: Planning – STI Data39
The Virginia DOT clearly documents cross-performance area programming. The table below lists some of the measures that are used to evaluate projects, organized by goal area. It also indicates how each measure contributes to the overall performance area score. This information is available on a publicly accessible website for ease of use and understanding.
Source: Adapted from About HB240
| Performance Area | Measure | Contribution |
|---|---|---|
| Safety | Number of fatal and injury crashes | 50% |
| Safety | Rate of fatal and injury crashes | 50% |
| Congestion Mitigation | Person throughput | 50% |
| Congestion Mitigation | Person hours of delay | 50% |
| Accessibility | Access to jobs | 60% |
| Accessibility | Access to jobs for disadvantaged persons | 20% |
| Accessibility | Access to multimodal choices | 20% |
| Environmental Quality | Air quality and environmental effect | 50% |
| Environmental Quality | Impact to natural and cultural resources | 50% |