Component 01
Strategic Direction
Implementation Steps
1.1 Goals and Objectives
The following section outlines the steps agencies can follow to develop a set of goals and objectives that establish an agency’s strategic direction.
- Understand the performance context to create a vision
- Build inclusive internal process to develop goals and objectives
- Engage external stakeholders to refine goals and objectives
- Evaluate and finalize goals and objectives
- Document the process
“The Bay Area Long Range Transportation Plan has shifted away from traditional goals like ‘system preservation’ and now fully reflects how transportation agencies can help the region’s citizens fulfill their priorities like ‘healthy and safe communities.’”
Source: Dave Vautin, MTC
Step 1.1.1 Understand the performance context to create a vision
Developing a vision is a useful and productive way for an agency to gain an understanding of the performance context as well as generate buy-in among staff before moving on to goal setting. Before beginning the goal-setting process, staff should assess the current context and have an understanding of how the transportation system is currently performing. This knowledge will help to frame the discussion about long-term transportation trends and needs for the future. Without context, an agency could easily select goals that are irrelevant, unimportant, or already well-addressed, making each subsequent performance-based planning and programming (PBPP) step less effective. A wide array of information will help establish an agency’s performance context, including historical and forecast changes in population and employment; current usage by mode; forecasts of expected changes in travel demand; and estimates of current and future transportation system conditions and performance.
Items to keep in mind when developing a vision:
- Examine current performance information to identify high and low performing areas
- Obtain understanding of what data exists to track goal/objective achievement
- Consider how much control the agency has over a particular outcome
- Identify risks that could prevent attainment of goals and objectives
- Consider regulatory requirements affecting performance measures
Examples
Assessment of Existing and Future Demographics, Climate, Travel Usage and Demand
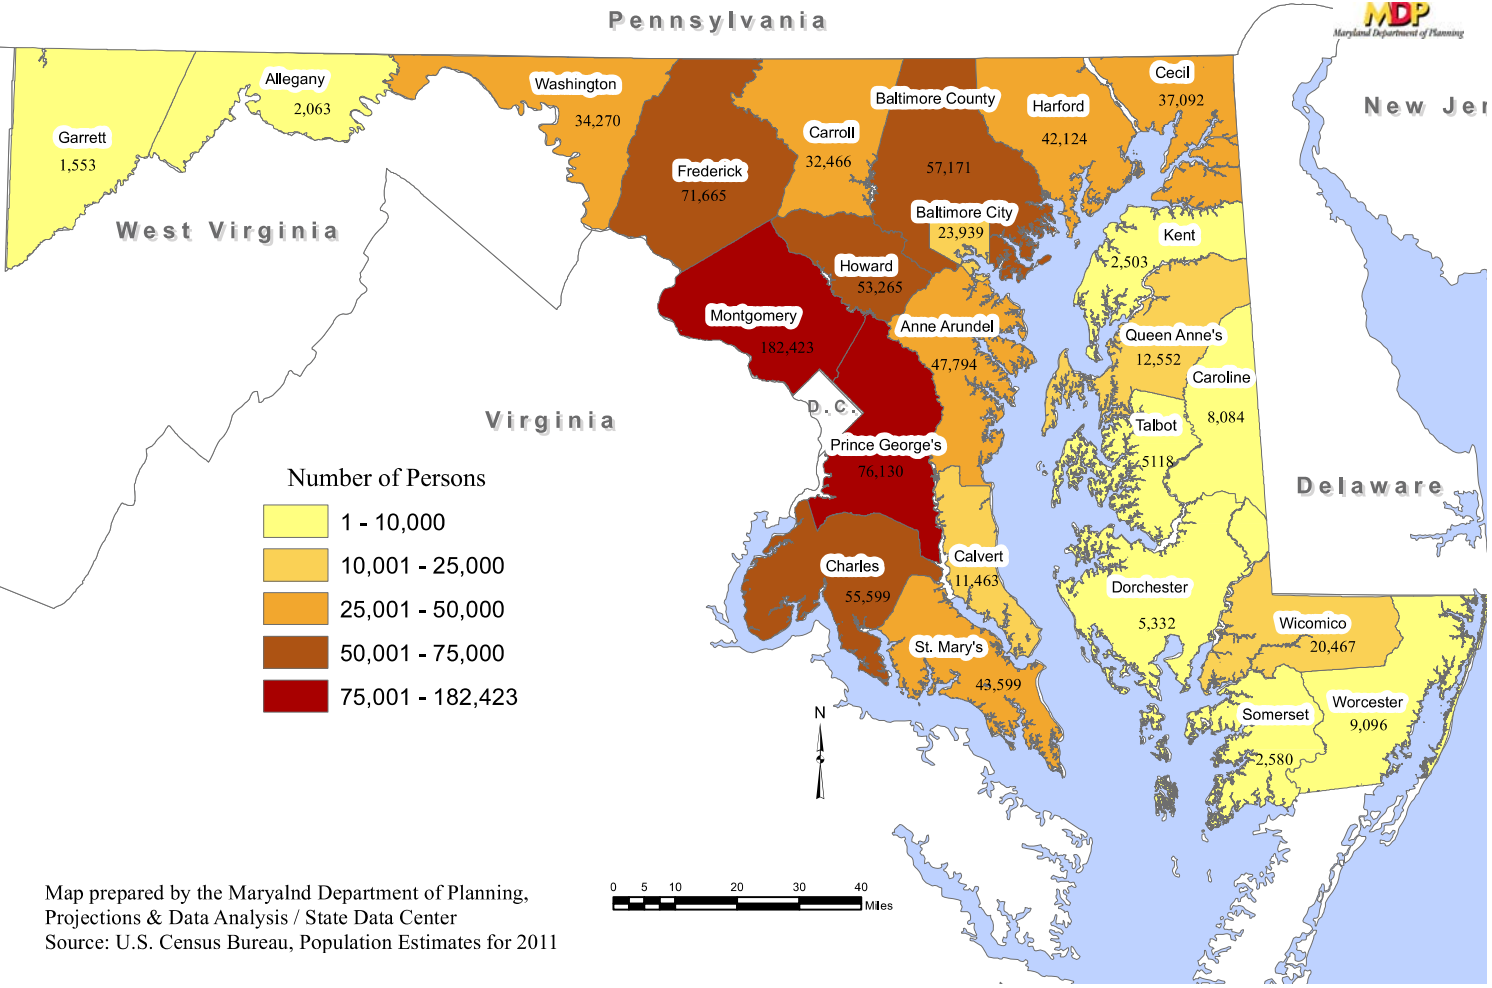
Understanding historical demographic and economic trends and forecasts help determine the context in which goals and objectives will be developed. Therefore, it is important to incorporate these external factors into the goal/objective-setting conversations (e.g., employment, economic, and industry trends and forecasts; population, households trends and projections, age group, and location). Agencies have also begun to focus on climate forecasts to be better prepared for an increase in frequency and severity of weather incidents. Obtaining this information will likely require partnerships with partners and stakeholders. The following graphics are examples of how agencies have summarized this important information. Figure 1-5 visually illustrates freight movement and commuting habits in Florida. Figure 1-6 displays projected average annual growth for the state of Maryland, by county.
Figure 1-5: Florida Freight Movements and Commuting Habits
Source: Florida Transportation Plan Vision Element18
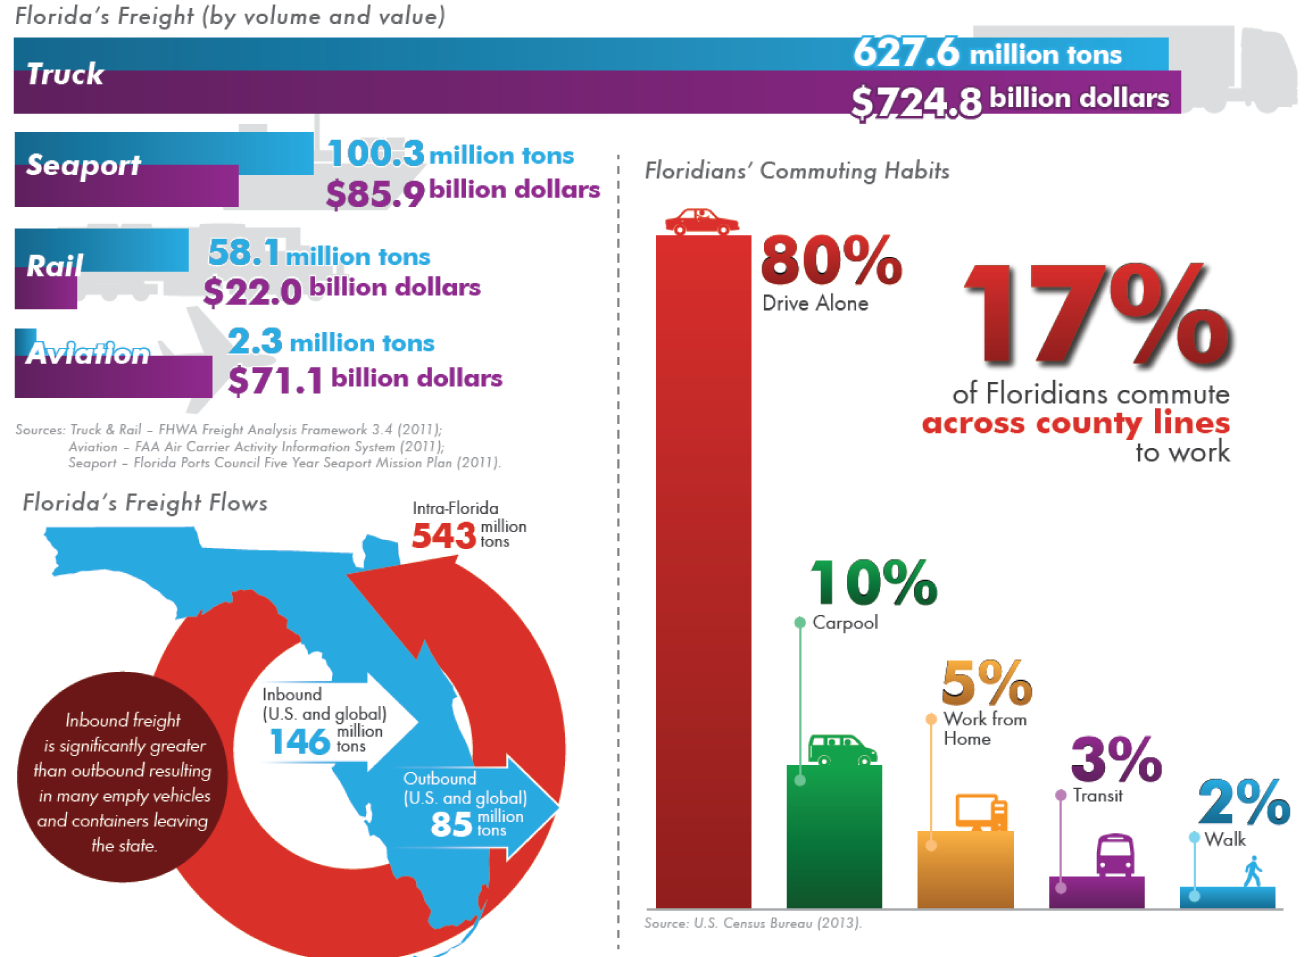
Figure 1-6: State of Maryland Projected Population Growth through 2030
Source: 2035 Maryland Transportation Plan: Moving Maryland Forward19
Inventory and Summary of Extent, Condition and Performance of Existing Transportation System
In order to address the external forces shaping transportation in a region, agencies should have a comprehensive understanding of the multimodal transportation system. A comprehensive inventory of existing infrastructure, current condition, and project performance highlight what aspect(s) of their system should be the focus of strategic goals and objectives.
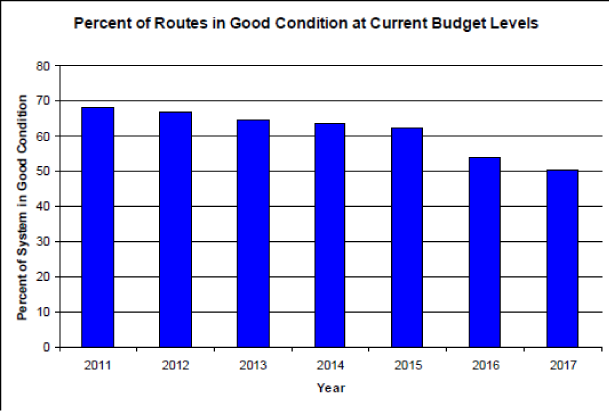
The NCDOT 2040 Challenges and Opportunities Report20 highlights the need to preserve the health of the state’s infrastructure to address mobility and logistic challenges. The assessments of the state highway system condition confirmed that pavement was in need of serious attention. The projection suggests that by 2017, the percent of pavement miles in good condition would drop to 50 percent. The current performance condition and dire projections helped focus the agency’s strategic direction on system preservation.
Figure 1-7: Pavement Performance Based on Current Budget in North Carolina
Source: North Carolina Report on the Condition of the State Highway System (2010)21
Linkages to Other TPM Components
- Component B: External Collaboration and Coordination
- Component C: Data Management
- Component D: Data Usability and Analysis
Step 1.1.2 Build inclusive internal process to develop goals and objectives
With an understanding of the performance context, staff involved up to this point should begin developing an inclusive process to set goals and objectives. This process will inherently build buy-in among others within the agency as long as it is truly inclusive. The shift to a performance-based focus affects the type and amount of work expected of staff, and therefore it is critical to make them aware of such changes from the beginning to ensure a smooth integration of new processes. This is also a time when staff should be informed of the benefits of PBPP and how it will improve agency outcomes. Lack of support across the agency can be a deal breaker, either preventing the process from going forward at all or making the process an empty exercise that will not garner any process changes.
Important actions to take in building internal buy-in:
- Identify who is involved internally: promote intra-agency involvement that will enable collaboration between typically isolated silos
- Ensure inclusivity: support by staff stems from a feeling of inclusion and ownership
- Decide who will manage the process
- Choose (or be aware of) who will approve the final goals
- Ground goals in agency priorities/focus areas: look at past goals and planning documents as a starting point
- Engage in a dialogue about the relative priority of different goals
- Ensure senior management team uses goal/objective language to reinforce employees’ contribution to agency success and highlight the agency’s role in broader societal concerns
Examples
Inclusive goal and objective development can take many forms:
| Web-based engagement tool | Staff can write suggestions and provide feedback to draft goals and objectives using an online portal. Executives would review comments and adjust draft list accordingly. |
| Workshop/ facilitated discussion | Held with various groups across the agency and modeled from external workshops can be used to gather feedback from the public and other stakeholders. Facilitating workshops enable staff to have input in an interactive and engaging way. |
| SWOT analysis | A way to assess Strengths, Weaknesses, Opportunities, and Threats of potential goals and objectives. With this method, there is ample opportunity for a wide range of topics to be included in the discussion, such as influence of the agency over outcomes and other topics identified in step one. |
| Tour of preliminary goals | A small group within the agency can develop a draft list of goals and objectives for review by the staff at large. The small group may provide a webinar or short seminar to orient other staff before gathering feedback. Feedback from the broader staff can be used to evaluate the draft goals and objectives to create the final list. |
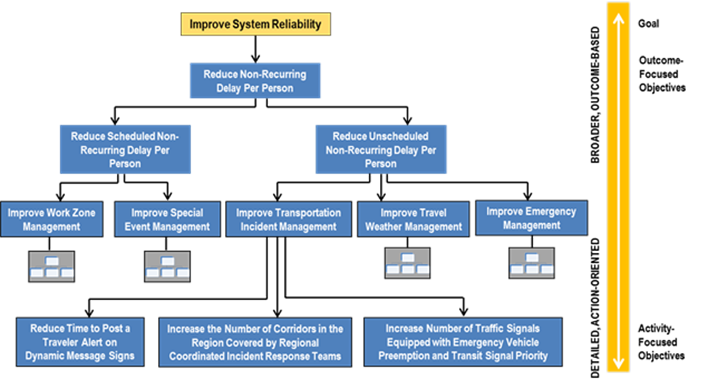
| Objective Tree | A transportation agency can select which objectives in the objectives tree are most important to be included in the LRTP or other planning documents. This can be seen below or viewed in the Performance Based Planning and Programming Guidebook.22
Figure 1-8: FHWA Objective Development Source: Advancing Metropolitan Planning for Operations: The Building Blocks of a Model Transportation Plan Incorporating Operations23
|
Linkages to Other TPM Components
Step 1.1.3 Engage external stakeholders to refine goals and objectives
Once internal buy-in is solidified and staff understands their role in the process, those outside the agency must be asked for their input. These groups include the public at large as well as other agencies and organizations; identifying which organizations and groups should be involved sets the stage for obtaining their input, which is critical to keeping the agency relevant.
- How do the agency’s activities support regional priorities?
- How do the initial goals and objectives drafted through internal engagement align with to external goals?
These questions can only be answered if asked to a broad and diverse cross-section of the community. Stakeholder engagement is also an opportunity for the agency to clarify the linkage between core agency functions and broader societal concerns and discuss the relative priority of different goals. Input from stakeholders should be used to refine goals and objectives so that they resonate outside of the agency. Given that goals determined within the Strategic Direction process will guide all agency work, effective engagement of external stakeholders is a key step.
In addition to making the goal-setting process more relevant, external engagement is also required under 23 USC § 134 (i)(6) and 23 USC § 135 (f)(3), as well as 49 USC § 5303 (i)(6) and 49 USC § 5304 (f)(3) as part of transportation plan development. Any interested parties should be included, as well as the general public, transportation providers, and representatives of system users.24A,24B Other agencies and governments, including Federal and Tribal, must be consulted as well. Metropolitan Planning Organizations (MPOs) developing the Metropolitan Transportation Plan must consult, as appropriate, “State and local agencies responsible for land use management, natural resources, environmental protection, conservation, and historic preservation.”25 States developing the LRTP must consult with MPOs, regional transportation planning organizations (RTPOs), tribal governments, and applicable Federal, state and local agencies.26
Items to keep in mind:
- Identify who is to be involved externally
- Connect draft goals and objectives to regional priorities (ask stakeholders: “what does X goal mean to you?”)
- Clarify the linkage between core agency functions and broader societal concerns
- Consider National Goals and Planning Factors when discussing priorities
- Discuss the relative priority of different goals
- Refine goals and objectives so that the language resonates with stakeholders
Examples
Binghamton Scenario Planning27
Spurred by a declining population and the need to update the LRTP, the Binghamton Metropolitan Transportation Study (BMTS), the MPO for the Binghamton, NY region, undertook an extensive external engagement process to identify community goals. Their first step was to create a Community Vision Team that included a representative cross-section of the community:
- Students and administrators from Binghamton University
- Human service providers
- Elected officials
- Business and economic development representatives
- BMTS staff
Facilitators presented the team with summaries of goals from local planning and economic development documents to discuss in a series of meetings. While there were some challenges in keeping all members of the team continuously engaged, the biggest challenge was convincing local elected officials and planning staff from different agencies to participate in a cooperative dialogue.
The previous LRTP lacked a clear community vision, but the updated plan reflects the goals proposed by the Community Vision Team, emphasizing how external engagement can link community goals to agency planning. In a reminder that internal buy-in is also critical, those involved noted that success hinged on the support of the MPO leadership who approved a departure from traditional methodology.
MTC PlanBayArea 2040
The Metropolitan Transportation Commission, the MPO for the San Francisco Bay Area, is currently updating its Regional Transportation Plan (RTP), known as Plan Bay Area 2040. To engage external stakeholders, MTC assembled a Performance Working Group comprised of representatives from cities; counties; transit agencies; congestion management agencies; the state; economic, equity, and environmental organizations; and members of the Policy Advisory Committee, made up of citizen representatives. This comprehensive group was engaged to develop goals and performance targets for the plan update.
To inform the working group, staff led public workshops during which goals from the original Plan Bay Area (adopted in 2013) were presented as a starting point; attendees voted for their top three most important. Once voting was complete, individuals were asked what goals were missing and wrote their ideas on sticky notes to assemble on the wall. This low-tech word cloud was assembled into the digital version shown here, with word size indicating the relative number of comments posted by participants.28
Figure 1-9: MTC Collaborative Goal Setting
Source: Plan Bay Area 2040 Spring 2015 Public Engagement Report29
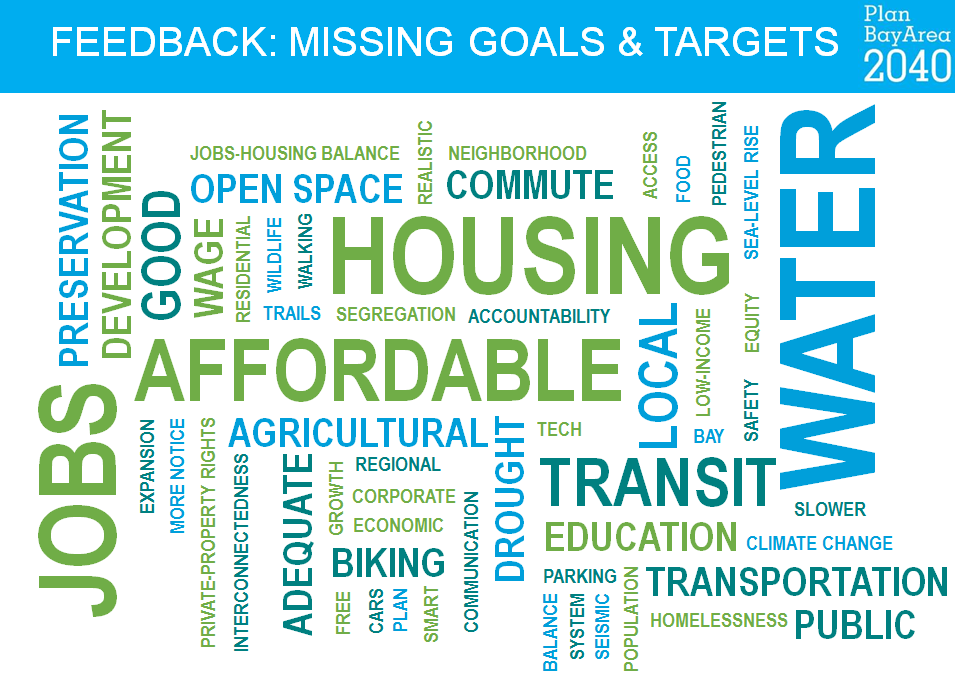
Water was a top goal area because of the ongoing drought. MTC staff noted that social equity, in terms of affordable housing, was elevated as a major concern in this RTP cycle, while economic vitality was a lower priority because of the strength of the area’s economy. This engagement process demonstrated how important it is for an agency to engage stakeholders on an ongoing basis because priorities can and do shift based on changing conditions. Staff also noted that stakeholder understanding of the impact of this process has increased each cycle; selection of goals can be contentious because stakeholders know that plan goals do in fact determine which projects are funded and how discretionary funding is allocated.
Linkages to Other TPM Components
Step 1.1.4 Evaluate and finalize goals and objectives
After a set of goals and objectives has been assembled, the list must be adjusted so each goal reflects the desired characteristics discussed in the introduction to this chapter. If the external stakeholder engagement step was done well, the goals will likely already be outcome-oriented and relatable to the public.
External engagement will also align initial goals with areas of key public concern. While these two characteristics may already be reflected in the agency’s initial goals, the National Planning Factors and Goals should also be considered. In addition, the agency should clarify the relative priority of each goal to set a clear strategic direction. As a result of this process, performance measure will start to become clearer.
As referenced in the introduction of this component, agencies may opt to use S.M.A.R.T. objectives. These objectives align with the principles listed here:
- Specific: The objective includes enough specificity to allow formation of strategies that will enable attainment without dictating said strategies.
- Measurable: The objective is quantifiable.
- Agreed: The objective is valid and important, as judged by stakeholders.
- Realistic: The objective can be attained with available resources and within particular political, economic, and other contexts.
- Time-Bound: The objective identifies a timeframe for attainment.
Refer to the Performance-Based Planning and Programming Guidebook30 for more information about S.M.A.R.T. objectives.
Desirable characteristics of goals and objectives (see Table 1-1):
- Attributable to agency
- Outcome-oriented
- Supported by available data, or by data that can be easily acquired or collected
- Operational
- Reflects Planning Factors, National Goals
- Limited in number
- Reflects broad societal concerns (goals only)
- Specific (objectives only)
Examples
Final goals and objectives will be unique to each agency but below is an example of how Champaign Urbana Urbanized Area Transportation Study (CUUATS) aligned its objectives with national goals, Illinois State Transportation Policy Factors, and the updated LRTP title Sustainable Choices 2040.
Goal: Increase availability and mobility of people and freight
Source: Champaign Urbana Urbanized Area Transportation Study31
| Draft Objectives | Elements of S.M.A.R.T. Objectives |
|---|---|
| Develop pedestrian plans for all jurisdictions within the urbanized area by 2020. | Defining “by 2020” for when the objective is completed supports the time-bound requirement of S.M.A.R.T. objectives. |
| Develop snow removal ordinances, programs, and policies for all jurisdictions to provide year-round access to sidewalks, bike paths, and transit stops. | Providing particular examples of how an objective is completed, such as “snow removal on sidewalks, bike paths” supports the specific feature of S.M.A.R.T. |
Goal: Transportation for underserved populations such as elderly, low-income, and persons with disabilities
| Draft Objectives | Elements of S.M.A.R.T. Objectives |
|---|---|
| Upgrade existing sidewalk network within the urbanized area by 10% to be ADA-compliant. | Identifying a 10% increase affirms the specific and realistic characteristics of S.M.A.R.T. objectives. |
| Improve below-average scores in five planning areas identified by the Local Accessibility and Mobility Analysis. | Defining five planning areas can easily be assessed to fulfill the measurement feature of S.M.A.R.T. |
Goal: Address issues of equity as well as segregation in diverse communities in the area of transportation
| Draft Objectives | Elements of S.M.A.R.T. Objectives |
|---|---|
| Provide at least one opportunity for public input for each new transportation project. | Providing opportunity for public input accomplishes the agreement aspect of a S.M.A.R.T. objective. |
| Make information materials on transportation modes, facilities, and /or benefits available in at least one language besides English. | Providing opportunity for public input accomplishes the agreement aspect of a S.M.A.R.T. objective. |
Linkages to Other TPM Components
Step 1.1.5 Document the process
Because the goals and objectives selected through this process will drive agency priorities, the selected set of goals and objectives should be reevaluated on a regular basis to ensure that the agency is maintaining focus on the most important areas according to both internal staff and external stakeholders. To make the process simpler and easier in the future, information about how each step was completed the first time around should be documented in detail. It is important to distribute this documentation internally and externally as appropriate to promote transparency and accountability as well as build internal buy-in among staff.
While there is no Federal requirement to document these steps, some of the steps themselves are required by Federal law, such as external outreach/engagement. In addition to making the external engagement process easier the next time goals and objectives are reevaluated, it may make sense to document how this step was undertaken to make it clear that the Federal requirement to engage external stakeholders was in fact met.
Documentation should:
- Outline coordination of goals across planning documents
- Explain how goals and objectives will be used in planning, programming, and employee performance evaluations
- Describe who fulfilled roles and responsibilities throughout the process
- Detail how each step was undertaken, and the result of each step
Examples
Virginia VTrans2035 Update
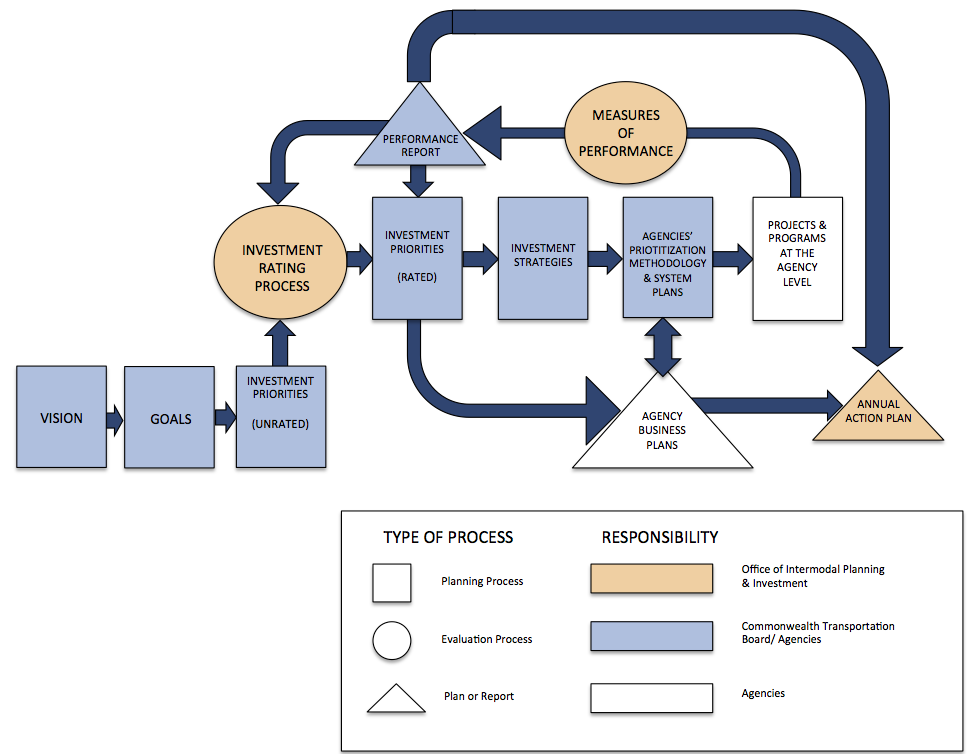
The update to VTrans2035 seeks to link projects to VTrans Goals by describing how goals will permeate through the later planning and programming processes. As measurable statements, Investment Priorities are analogous to Objectives. In each cycle, Investment Priorities are rated based on performance measures (which indicate need) and cost-effectiveness. Investment Strategies are key tactics that modal agencies can implement through plans and programs to achieve Investment Priorities and therefore drive attainment of Goals. Specific projects from state and regional plans are linked to Goals through the succession of Investment Priorities and Investment Strategies. The diagram below shows how the VTrans2035 LRTP documents how Goals impact the planning and programming processes.34
Figure 1-10: VTrans2035 Investment Priority Planning Process
Source: Adapted from 2035 Update, VTrans35
“Agency processes such as needs evaluations, performance rating, and project prioritization can be shaped in terms that relate directly to VTrans. This consistency… promotes the alignment among policies, plans, and funding programs that is necessary to gauge accurately the effects of transportation decisions on system performance.”
Source: Commonwealth Transportation Board. (February 2013). VTrans2035 Update: Executive Summary.
Vermont Agency of Transportation (VTrans)
VTrans describes both external and internal engagement in developing its Long Range Transportation Business Plan. A public opinion survey was commissioned to determine public priorities for projects, services, and other agency outputs and the results were compared to a previous survey conducted in 2000. In addition to external input, the Vtrans has an Internal Working Group that comments on draft objective language. Final objectives provide the framework by which planning and programming strategies will be developed. When drafting goal statements, Executive leadership obtained input from VTrans staff and solicited input for draft objective language. The current LRTBP identifies multiple policy options for each objective based on a variety of future scenarios, setting it apart from past plans and making it clear that the process is dynamic.36
Linkages to Other TPM Components
1.2 Performance Measures
From the goals and objectives approved in subcomponent 1.1, the agency chooses performance measures to track progress toward attainment. Another important result of the performance measure selection process is the establishment of a governance process that can be used to assess, modify, and add measures in the future, allowing an agency to continuously refine its transportation performance management program.
- Inventory data, tools, and performance reports
- Engage internal staff and external stakeholders
- Evaluate potential measures
- Establish governance process
- Document the process and measure details
“Why do we look at performance information? It is pretty simple. We are investing money in our transportation system and want to know what we get for it. Performance measures let us understand the relationship between investments and results.”
Source: Camelia Ravanbakht, Hampton Roads Transportation Planning Organization
Step 1.2.1 Inventory data, tools, and performance reports
Similar to step 1.1.1, some groundwork should be done to understand where the agency stands in terms of data, tools, and performance reports. Selection of measures will depend on whether the agency has existing data to support the measure, or whether there is capacity to collect or acquire new data. However, the existence of data does not guarantee its usability for this new purpose. Many agencies have a wealth of data, but do not have systems in place to create usable information from it. Knowing the state of data will help define the scope of the measure selection process; agencies with well-established systems that allow for data usability can choose measures directly related to those data streams. Agencies with less well-developed data management should scale back their measure selection process to make it more manageable. It may make more sense to select just a few measures with the data that is currently usable and expand at a later date once more data are available. However, some agencies may choose to use this measure selection process as an impetus for tackling problems associated with data, whether it is a lack of it, or a lack of usability.
It is also important that forecasting tools exist related to the data and measures. Without a method to forecast future conditions, it will be very difficult to complete Target Setting (Component 02) processes.
Finally, performance reports contain potential measures that are proven to have all the necessary elements discussed above. While it will be important to evaluate them for usefulness under the goal areas selected in subcomponent 1.1, they provide a starting point for discussion. Performance reports will also support the target-setting process (Component 02) by providing information on current performance levels.
- Identify and document data owner and source
- Consider whether data are useful and reliable in its current form
- Contemplate tackling data usability and reliability issues
- Inventory forecasting tools
- Use performance reports as discussion starter
Examples
DDOT Measure Development
Prompted by language in the comprehensive plan, the District of Columbia Department of Transportation attempted to develop a new measure termed person through-put. The comprehensive plan tasked DDOT to reduce reliance on level of service as a primary evaluation tool; the organization desired a broader set of measures that would capture more information when measuring the movement of people. It was not intended that level of service be eliminated, but rather additional measures would be included alongside.
Person through-put proved difficult to develop. The agency struggled with its definition and whether it would be useful as developed. The measure relied on travel modeling, which introduced issues of data quality and accuracy of prediction outputs from coarse tools such as a travel demand model. Staff produced more accurate predictions using a microsimulation, but concluded that it would be prohibitively expensive for regular use in planning.
When applied to a study for an exclusive transit lane on Georgia Ave, the person through-put measure did not clearly indicate whether improved transit would move enough people to compensate for those in vehicles displaced by the transit lane.
DDOT staff learned valuable lessons that other agencies should consider when beginning the measure selection process.
- Developing new measures takes significant thought.
- Many staff began the process expecting it to be relatively straightforward, but found it to be complex and difficult.
- Existing measures like level of service are used for a reason – they are easy.
- Linkages between data, tools, and measures are not necessarily clear.
For agencies starting down the path of transportation performance management for the first time, it may make sense to use measures that are well-established so that time will be spent on measures known to be easily usable. However, it is important that agencies critically analyze the limitations of existing measures.
Linkages to Other TPM Components
- Component 06: Reporting and Communication
- Component C: Data Management
- Component D: Data Usability and Analysis
Step 1.2.2 Engage internal staff and external stakeholders
Once the agency understands which data are usable and what current performance levels are, the process of engagement can begin. Both agency staff and external groups should be consulted when developing measures. Obtaining input from various groups will expedite the evaluation process in the next step when determining if the public and other external groups can easily understand a particular performance measure. This will also be important when reporting results, covered in depth in Component 06: Reporting and Communication. Internal staff should, now that they understand the performance context, be able to determine whether certain measures are forecastable or measurable with existing tools and data. This combination of internal technical understanding and external, generalist perspective will ensure that a useful set of initial measures is developed in this step.
Items to keep in mind:
- Ensure a diverse group of stakeholders is invited to participate
- Engage technical and nontechnical individuals
Examples
External Stakeholders: Maryland Attainment Report Advisory Committee
As of 2000, Maryland law requires publication of an annual Attainment Report that includes performance indicators to track progress toward achievement of goals and objectives in the Maryland Transportation Plan (LRTP) and the Consolidated Transportation Program (6-year capital budget).37 The law was updated in 2010 to create an Attainment Report Advisory Committee comprised of specific stakeholders such as:
- A representative of rural interests
- A representative of an auto-users’ group
- A representative of a transit-users’ group
- A nationally-recognized expert on pedestrian and bicycle transportation
- A nationally-recognized expert on transportation performance management
- And others
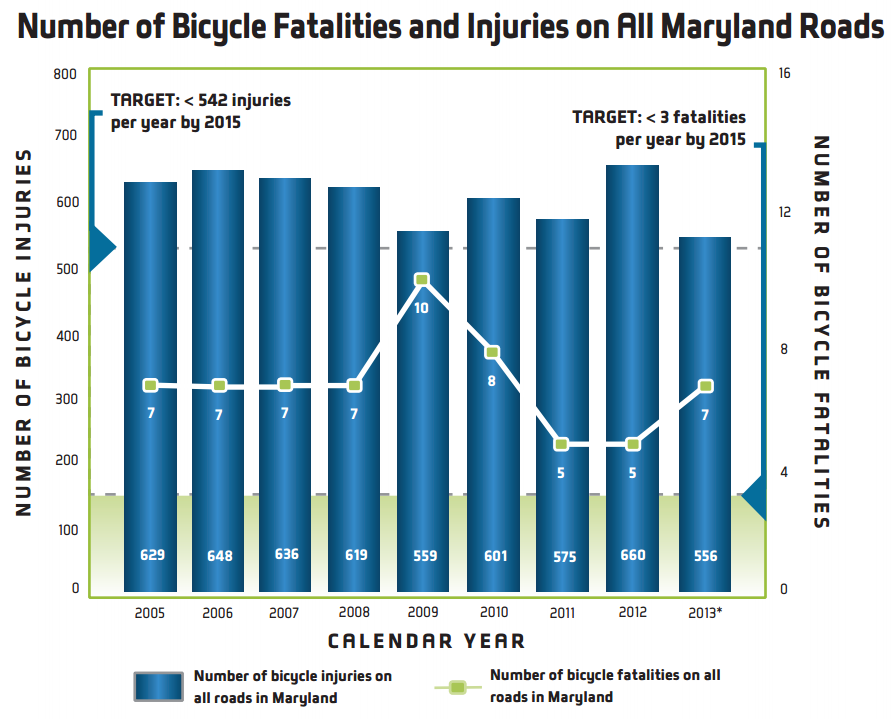
The committee is charged with reviewing use of performance measures in other states to advise MDOT on goals, benchmarks, and performance measures. An example of such a measure is below. MDOT staff as well as staff from the modal administrations within the department work with the committee to develop performance measures each time Maryland’s long-range plan is updated, or every three years.
Figure 1-11: Measuring Safety for Bicycle and Pedestrians at MDOT
Source: 2015 Annual Attainment Report38
Linkages to Other TPM Components
Step 1.2.3 Evaluate potential measures
What gets measured gets managed, so it is important to select performance measures thoughtfully. An agency should consider the characteristics discussed in the introduction to this chapter and listed in Table 1-2. Selected measures will have a strong impact on agency priorities because they will be tracked and reported. A classic example is congestion measures, whereby choosing to measure volume/capacity ratio will push the agency toward capacity solutions such as roadway expansion. While this could be acceptable to an agency, this likely result should be understood during the selection process and weighed against other potential measures such as person-hour delay that may allow for more multimodal solutions. Measures can push agencies away from their stated goals if they favor undesirable solutions as the only way to move the needle.
The evaluation process feeds into the next step of establishing a governance process. To streamline the next steps and future iterations of the process of setting up the strategic direction, it is important to record how measure selection was conducted, what was decided, and why.
Items to keep in mind:
- Consider the desirable characteristics in Table 1-2.
- What type of solutions will a particular measure push the agency toward?
- Do measures create potential conflicts?
- Create a user-friendly and standard form for evaluation.
Examples
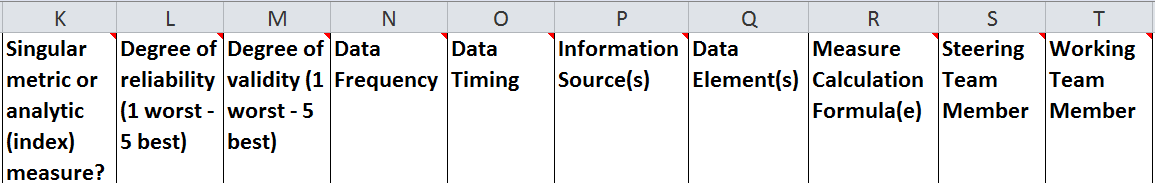
WisDOT Measures Profile
The Wisconsin DOT (WisDOT) uses an extensive spreadsheet to assess potential measures; factors include a one to five rating of measure reliability, how often data are collected, who is responsible for the measure, and unit of measure. Each measure is listed according to the goal it seeks to measure. The spreadsheet has been designed for ease of use with pop-out info boxes that further explain particular factors. It is important that the process is as robust as possible, while also being simple and straightforward for the user. WisDOT’s spreadsheet also tracks measures by year and lists the performance target for each measure, allowing the same document to be used for evaluation of potential measures as well as for recording progress toward attaining targets.
Figure 1-12: Performance Measure Evaluation at WisDOT
Source: Wisconsin Department of Transportation39
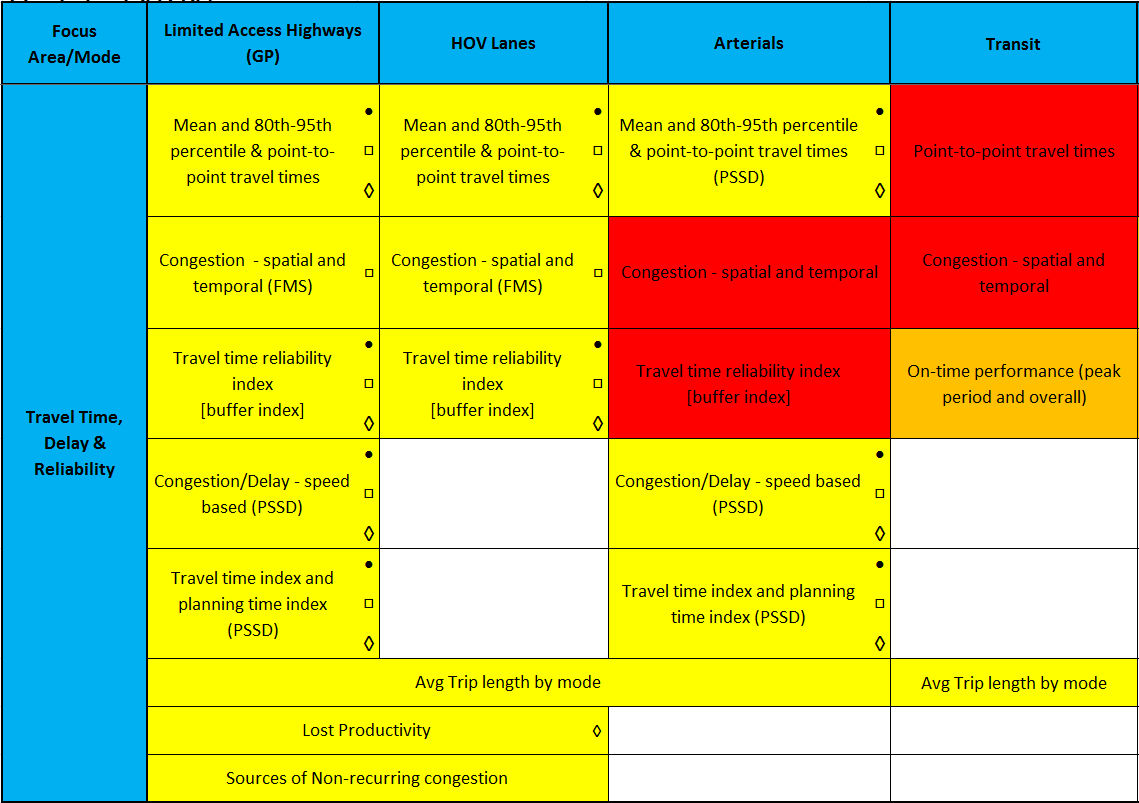
Maricopa Association of Governments (MAG)
MAG uses the following matrix to visualize data availability for potential measures. Measures are arranged according to mode and focus area and are identified as system, corridor, or segment level measures. Data availability is indicated by the color of the cell; yellow indicates data are available, orange indicates partial data are available/refinement is needed for usability, and red indicates that no data are available or significant refinement is necessary. This “road map matrix” method clearly demonstrates at a glance which focus areas and modes are lacking in usable measures, assisting the agency in refining measures through further development of the Transportation Performance Management Program.
Figure 1-13: Maricopa Association of Governments Measure Evaluation Matrix
Source: Maricopa Association of Governments40
Linkages to Other TPM Components
- Component B: External Collaboration and Coordination
- Component C: Data Management
- Component D: Data Usability and Analysis
Step 1.2.4 Establish governance process
With final measures approved, the agency is then ready to document the process and move to target setting. However, the performance measures selection process is not a one-off activity; measures should be continually assessed and modified. A governance process must be created to manage these adjustments to ensure changes reflect the needs of the agency and external stakeholders, data constraints, and other factors.
Important questions to ask:
- Obtain internal feedback from different users across the agency: will the selected measures support decision-making?
- Gather feedback from external stakeholders on higher-level measures: do they resonate?
- Consider gaps: what does the agency want to measure, but can’t, because of data limitations? What new data sources are in the pipeline?
From answers to the above questions, the agency should adjust selected measures, develop supplementary measures that will provide additional support for decision-making, and explore the feasibility of collecting new data to fill gaps. Data may already be collected, but are not in an accessible or usable form; consider options to make such data useful for decision-making.
Examples
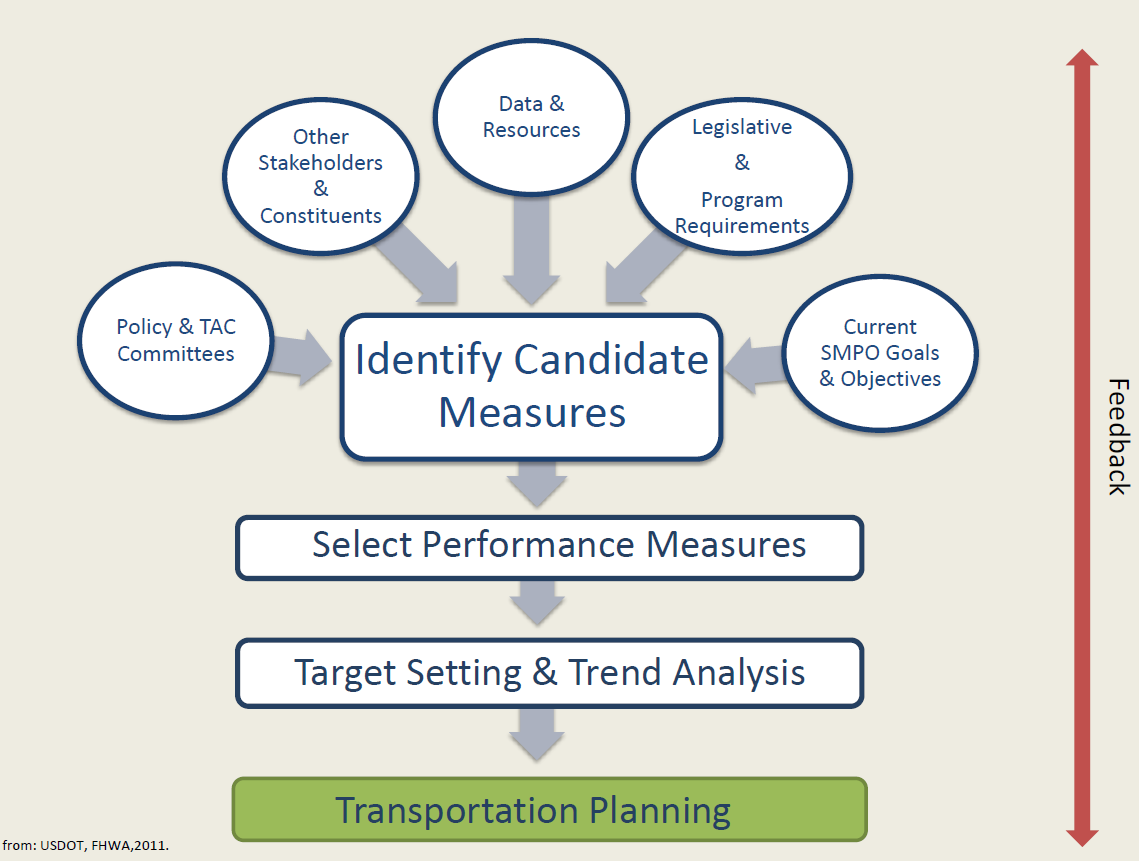
The Strafford MPO, which covers the Dover-Rochester-Berwick, ME urbanized area in New Hampshire and Maine, has a well-defined performance measure governance process. Initial measure selection considers a number of factors as shown below.41
The Policy and Technical Advisory Committees42 comprise representatives from a number of external stakeholders including NHDOT, local municipalities, the University of New Hampshire, and FHWA. In addition to input from these committees, SMPO considers data/resource constraints, statutory requirements, and its own goals and objectives. With selected measures, targets are set and incorporated into the planning process. The dynamic nature of SMPO’s process is depicted with the feedback arrow that spans the full length of the performance measure selection process as well as target setting and planning.
Figure 1-14: Strafford MPO Performance Measure Governance Process
Source: Performance Based Transportation Planning Presentation43
Linkages to Other TPM Components
- Component A: Organization and Culture
- Component B: External Collaboration and Coordination
- Component C: Data Management
- Component D: Data Usability and Analysis
Step 1.2.5 Document the process and measure details
Like the goal selection process, the measure selection process should be documented to streamline future iterations. However, for performance measures, it is vital to document the measures themselves including how they are calculated, what data sources they use, and other details. Among other reasons, it will prevent inaccurate comparisons among agencies that use a measure of the same name but different underlying calculations.
Step 1.2.1 directly feeds into documentation. All of the information collected in the inventory of data, tools, and performance reports should be recorded in this step for future reference.
Document:
- Data owner and source
- Measure calculations
- Final selection of measures
- How to identify and close performance measurement gaps
Examples
WMATA On-Time Performance Comparison
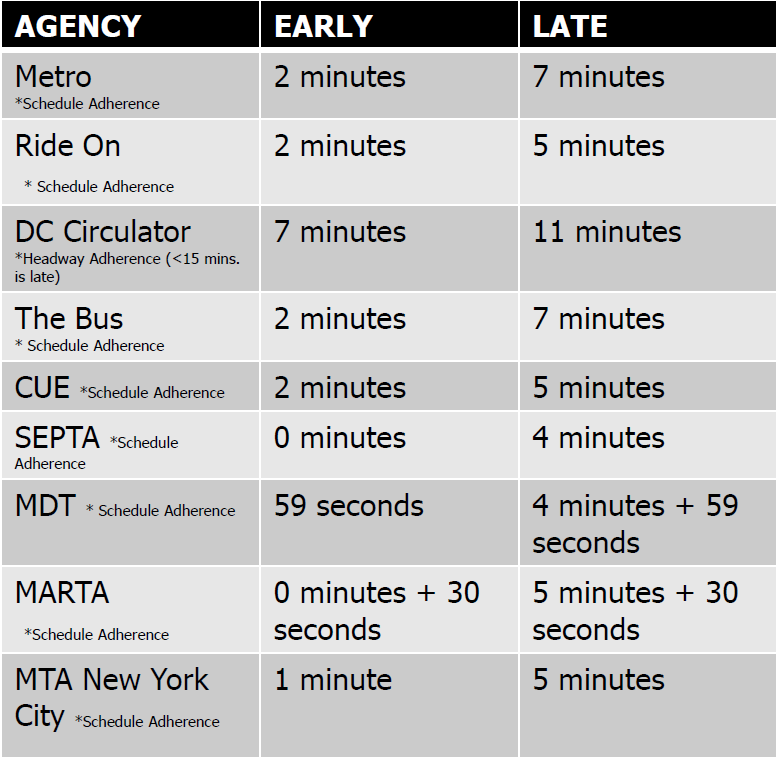
When the Board of the Washington Metropolitan Area Transit Authority wanted to compare bus on-time performance (OTP) with other agencies, staff found such a comparison to be a challenge. No industry standard exists for measuring and reporting this metric, yet many agencies use the same name: bus on-time performance. It is impossible to precisely compare one agency to another with widely varying parameters of what is considered late or on time. Figure 1-15 summarizes a few agency parameters for OTP. WMATA (listed as Metro in Figure 1-15) defines on-time performance as the “difference between scheduled time and actual time arriving at a time point based on 2 minutes early/7 minutes late parameters.”44
While it may seem clear from Figure 1-15 which agency has the most rigorous definition of OTP, there is another aspect of this performance measure that must be noted; agencies also record bus arrivals in differing ways. Some agencies like Miami-Dade Transit include every stop on a route, but do not include departure and arrival at garages. MARTA only measures departures.
Figure 1-15: Comparing Public Transportation Performance Measures
Source: Bus Performance Board Nov. 201045
This example demonstrates the importance of clearly documenting every aspect of each performance measure the agency selects. In the target-setting process (Component 02), the agency may decide to benchmark with peer agencies to create a context for the target being set. Knowing the details and definitions behind both internal and external measures ensures that benchmarking provides useful information to help set a proper target.
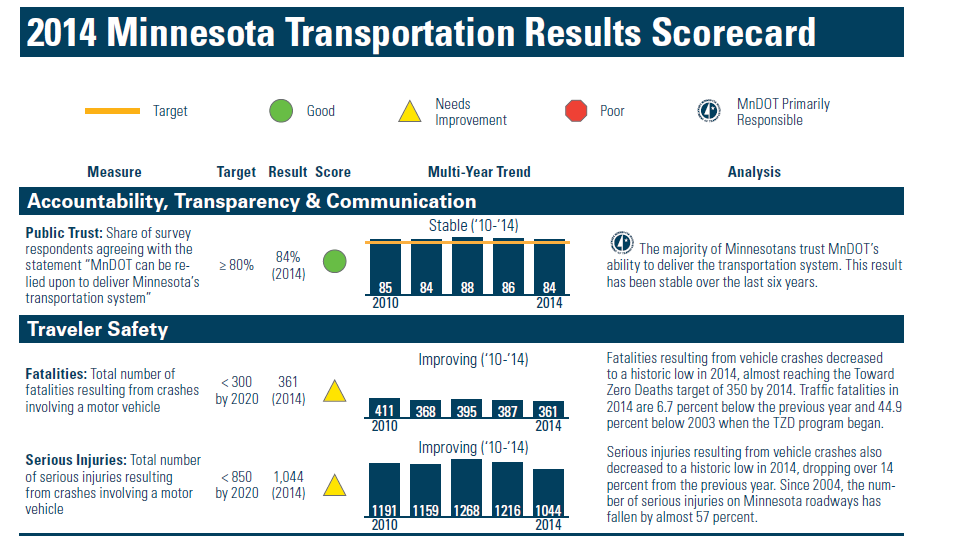
Minnesota Department of Transportation Performance Reporting
In an effort to evaluate service delivery and program effectiveness, MnDOT established a transportation performance management plan intended to ensure transparency, support decision-making and enhance management practices. To communicate performance to stakeholders, the organization created a transportation results scorecard documenting measures, targets, results, score, and trend figures, along with an analysis of results. The components shown below illustrate how MnDOT documents and shares its data and delivers performance results.
Figure 1-16: Encouraging Transparency through Self-Reporting with MnDOT
Source: 2014 Minnesota Transportation Results Scorecard46