Component 06
Reporting and Communication
Implementation Steps
6.1 Internal Reporting and Communication
The following steps will enable effective internal reporting of transportation performance management information:
- Clarify purpose of the report
- Define roles and responsibilities
- Develop reporting parameters
- Refine, automate, and document
“Reporting performance data [promotes an] understanding of the impacts of investment decisions…on the state of the transportation system, [providing] the key inputs that should be used to establish priorities during subsequent strategic planning phases and to measure progress on previous strategic goals.”
Source: NCHRP Report 660: Transportation Performance Management: Insight from Practitioners
Step 6.1.1 Clarify purpose of the report
This step highlights the need for clarity in report intent. Before starting to create a report, it is important to initiate a discussion among a range of potential users of the report to determine how the report will be used internally. The report may be intended to influence change within the agency, or it may connect implemented changes to operational results. The group of users will determine its purpose, setting the stage for creating a valuable and useful report.
To target the appropriate level of staff, reports will be written with varying degrees of detail. For executives, data may be more high-level with the option to drill down; operational staff will be more interested in details, especially if the purpose of the report is to effect change in operational strategies. If performance has fallen short of targets, the report should demonstrate this in a sensitive way. This should be carefully considered to ensure a positive and proactive response from report users.
Different staff has varying levels of understanding as well; it will be important to provide context as necessary for full comprehension by the intended audience. Context can be established by recalling state or federal law or noting examples in other states where measures were used to achieve desired outcomes.
Source: Federal Highway Administration
| Audience | Potential Purpose |
|---|---|
| Secretary/General Manager | Prepare for meetings with elected officials |
| Executive managers | Hold department heads accountable for performance results |
| Department heads | Identify areas in need of attention |
| Operational staff | Link daily work activities to performance results |
The agency should determine whether the specified audience is high enough in the organization to influence change vs. operationally connected to implement those changes. Without custom tailoring for the audience, the report will contain excess measures and documentation which will distract from the main message. Users may tune out or become frustrated.
Items to keep in mind:
- Connect TPM to existing business processes
- Define the TPM process and why it is beneficial
- Specify how the report will be used
- Tailor to the audience
- Consider user reaction to falling short of targets
- Report on most critical items for internal management needs
Examples
Targeted Performance Reporting16
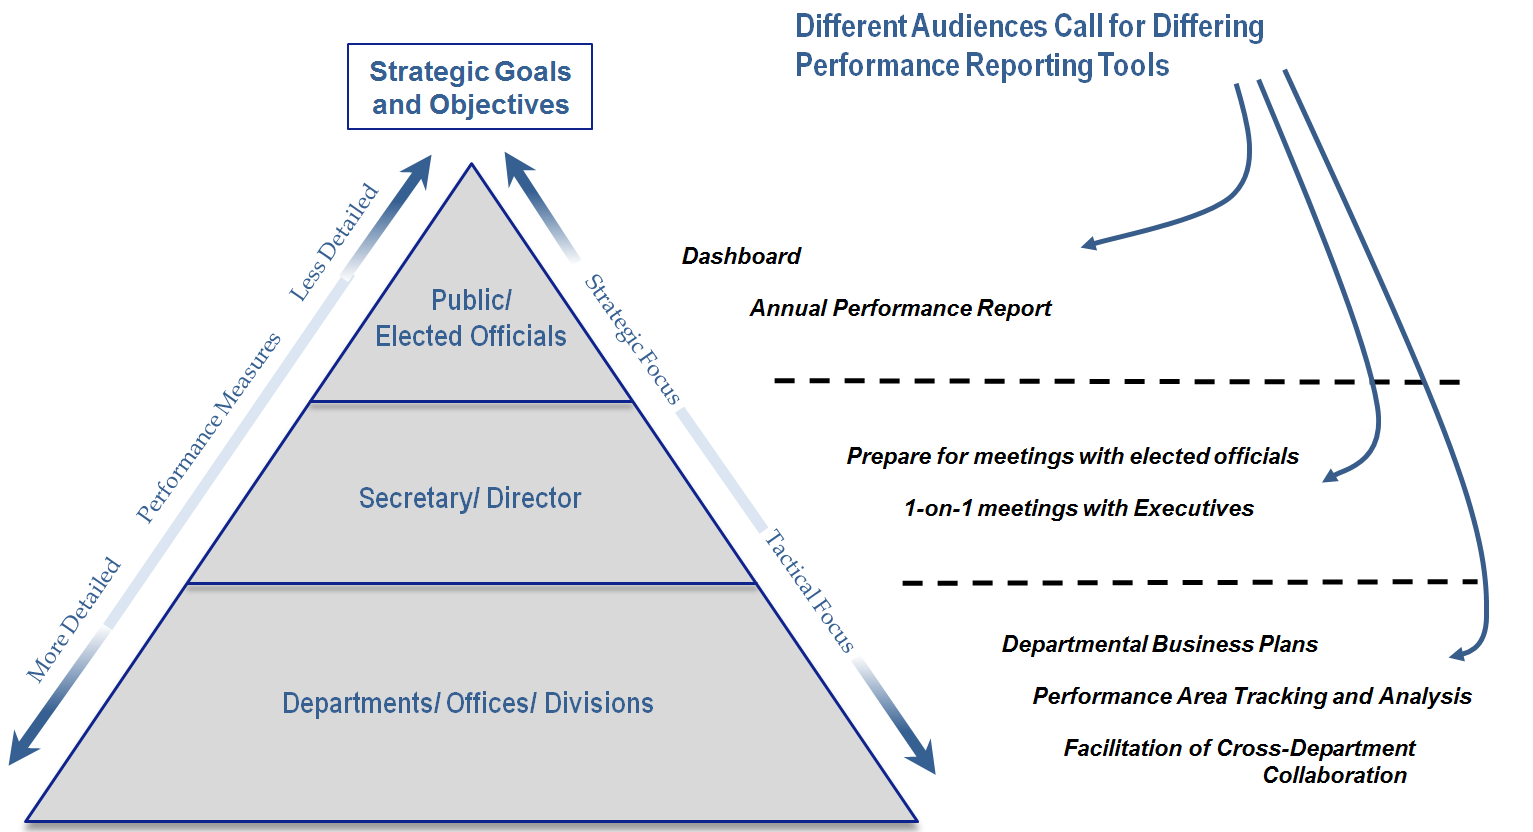
The diagram below clearly shows how various reporting products can be used by which staff and how those reports vary in level of detail and focus. Dashboards can provide high-level information to the public and elected officials in an easy to understand format, while annual performance reports can include more detail while still maintaining an overall perspective. Reports to the Secretary or Director will often be to prepare that individual for meetings with department heads or elected officials and should be tailored to this purpose. Department business plans can be used to maintain focus on actions that will produce positive performance outcomes by guiding discussions during department or office meetings. Specific tracking of performance within particular areas is more relevant to frontline works and office heads and should be reflected in reports at this level.
Figure 6-5: Hierarchy of Reporting Methods and Tools
Source: Washington Metropolitan Area Transportation Authority17
Linkages to Other TPM Components
Step 6.1.2 Define roles and responsibilities
This step entails specifying staff to deliver the report. Once the purpose of a particular report is identified, staff within the agency must be assigned to gather information, write, and design the report. Because every part of the organization contributes to performance results, every part of the agency will also need to report either separately or contribute to an overall agency report.
Ideally department staff will undertake this important aspect of transportation performance management, but some agencies engage a transportation performance management office to assist. When departments take responsibility for reporting their own results, staff has ownership over the process, which in turn encourages involvement throughout each of the components in the TPM framework.
Staff responsibility for particular performance areas should be clear. Because TPM is a process with each component interrelated, reported information will eventually be used to adjust agency strategies, goals, and targets. Without clearly-defined staff member responsibilities, adjustment and improvement is less likely to occur.
An agency should:
- Ensure management and executive support and reinforcement
- Assign staff to seek feedback on past reporting efforts, and to improve subsequent reports for use in decision-making
- Identify who within the departments or performance office will actually do the writing, feedback solicitation, etc.
- Link to existing processes that require reporting as much as possible to reduce duplicative work
Examples
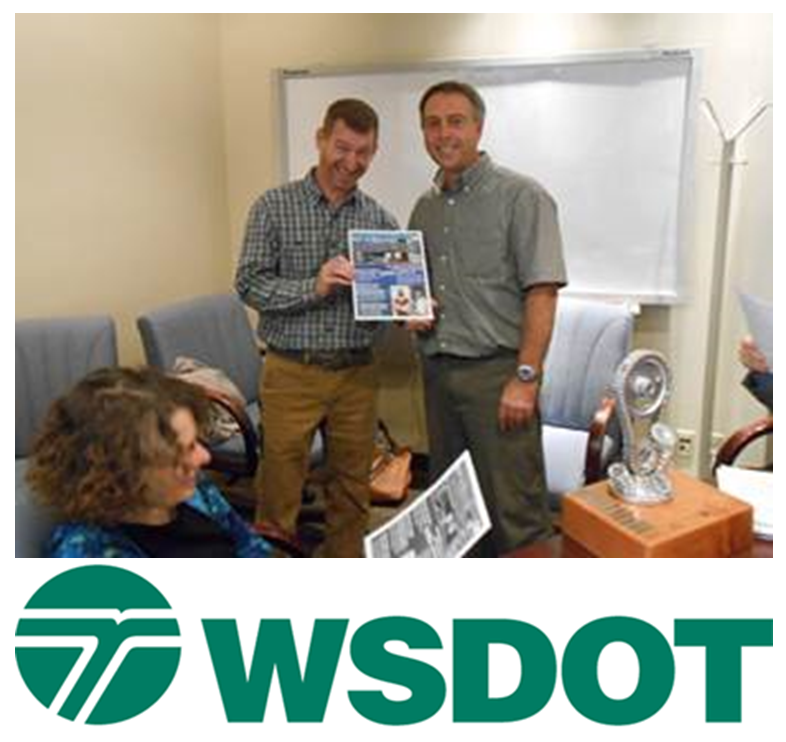
The Gray Notebook Award: Rewarding Employees
The Washington State DOT has a performance trophy called the Gray Notebook Award, which is given out to an employee who goes above and beyond in contributing to reporting efforts. The award is given out quarterly, coinciding with the agency’s release of its quarterly performance report, The Gray Notebook. Award winner keeps the trophy for the quarter and their name is engraved on the plaque. The award is one way WSDOT is able to continually produce such an impressive reporting piece.
Figure 6-6: Staff Award at WSDOT
Source: WSDOT18
TriMet: Portland, OR
The agency posted a map at garages showing the location of bus collisions along routes in an attempt to highlight areas of low performance to bus operators. Unfortunately, because of limited staff time and resources, the map data was not updated regularly enough to be useful to operators. TriMet had a great idea for reporting performance internally, but the challenges faced in maintaining this internal reporting demonstrates how important it is to have staff capacity for reporting roles, and to clearly define responsibilities for staff to complete reporting tasks on an ongoing basis.
Linkages to Other TPM Components
Step 6.1.3 Develop reporting parameters
This step addresses the need to define how the report will look visually, and what data is included. The reporting format chosen will be impacted by the purpose of the report determined in step 6.1.1. To produce a useful report, the reporting parameters should reflect the needs of the intended audience and enable the reported information to be easily digestible. Decisions can range from simple (web v. hard copy) to more difficult (infographic v. graph v. interactive data display). Take into account how much detail and added context is necessary in the report and how this may impact the format. Above all, the most important information should be presented prominently and in a comprehensible manner.
“Too much data becomes not enough information – focus on the most important data and present it in a way that can be understood.”
Source: Eric Hesse, TriMet
Other items to consider when developing reporting parameters include:
- Frequency: If a report will be produced frequently, the format should be simple to reduce effort required. It is also important to consider whether agency investments might produce results in the short or long term. By reporting quarterly results for a measure that will not be affected by investments for a number of years, it will appear that agency strategies are not effective. Because reporting will affect these strategies, reporting must be done thoughtfully to avoid unnecessary or potentially counterproductive adjustments. In addition, high-level reporting should coincide with decision cycles and be infrequent.19
- Data sources: Determine where performance data will be derived from and when they will be available for use. Avoid committing to monthly reports if data will only be available quarterly. Data must also be accurate.
- Alignment to TPM framework: Reporting should be undertaken with the knowledge that it will influence other TPM components (e.g., goals, measures, targets, plans).
- Inclusion of actionable information: Without this, reporting serves little purpose within the transportation performance management framework; agency approaches must be adjusted based on reported information to ensure that desired outcomes (goals) are being achieved. Often, internal reporting focuses on output measures because they more directly relate to agency activities.20
- Mandates: Does reporting meet federal or state legislative or regulatory requirements? Does it help explain the impact of current and future investment levels?
- Internal evaluations: Will information be used for individual or department evaluations? Is there a reward or recognition structure associated with any measures? Should an employee be able to link their job to these measures?
Examples
Reporting to Adjust
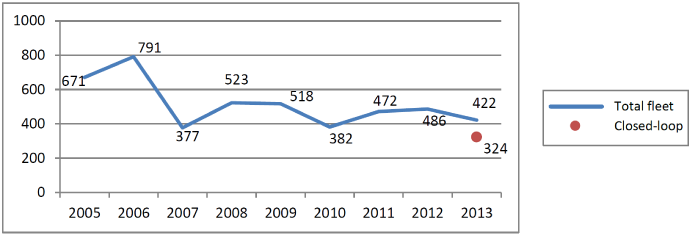
The Rhode Island DOT Maintenance Division, responsible for winter roadway maintenance, adopted performance measures to assess salt, brine, and sand usage. To reduce winter maintenance costs, the DOT installed closed-loop controllers on a portion of the maintenance vehicle fleet. These controllers provide more uniform salt and sand application compared to standard systems, and also allow computerized data tracking of application. By installing these devices on only a portion of the fleet, the DOT could compare usage and costs between standard and closed-loop vehicles. The new technology achieved a 20-30 reduction in material usage, as shown in the graph below. Reporting using easy to read graphs enables staff to quickly understand important information that will allow the DOT to more efficiently use resources.
Figure 6-7: Average Pounds of Salt Per Lane Mile
Source: Moving a DOT to Excellence with Performance Measures21
Linkages to Other TPM Components
- Component 01: Strategic Direction
- Component 02: Target Setting
- Component 03: Performance-Based Planning
- Component C: Data Management
- Component D: Data Usability and Analysis
Step 6.1.4 Refine, automate, and document
Reports should be continuously refined based on user feedback. Each subsequent report should be improved to ensure the agency is telling its story in the most effective manner. Encourage report users to identify where improvements can be made, and ensure that a range of users are solicited for their feedback to avoid tailoring too finely for only a small subset of the intended audience. A staff member assigned to obtain feedback under step 6.1.2 should fulfill this responsibility for both internal and external reports. With feedback in hand, staff should return to step 6.1.3 to refine things such as frequency and format. Each round of reporting should build on the previous one to improve usability and value for addressing performance challenges. Reporting is not a rote exercise; the feedback and refinement process is a critical one because of the impact reporting will have on agency strategies and subsequent results.
As much as possible, gather data automatically. This will reduce time required for staff to assemble and produce the report. For example, existing communication templates can be auto-populated with new data for the quarter, year, or other performance period being used. However, be cautious with automation. If data quality issues exist, even partially automated reports are likely to communicate inaccurate information.
Ensure the process of data gathering, calculation, writing, publication and solicitation of feedback is documented. Include data sources, individuals who fulfilled particular roles, intended audience, user feedback, etc. Most reports will be produced on a regular basis and documentation will streamline the process in the future and protect against loss of institutional knowledge if a key member of the team changes positions.
“We’re constantly re-evaluating our reports, thinking tactically, strategically, about relevance.”
Source: Daniela Bremmer, WSDOT
Examples
Maricopa Association of Governments (MAG)
The Performance Management Program at MAG was initiated as a result of 2004 state legislation that mandated a performance-based Regional Transportation Plan (RTP) subject to a performance audit starting in 2010 and every five years thereafter. Passage of Proposition 400 in Maricopa County authorized a half-cent sales tax for 20 years to fund transportation projects. As part of the shift towards transportation performance management and to report on the projects funded by the sales tax, MAG created two robust reporting tools: MAGnitude—a web-based transportation performance dashboard, and a web based RTP Project Card portal.
Figure 6-8: MAG Web-Based Transportation Performance User Interface
Source: MAGnitude Transportation Performance22
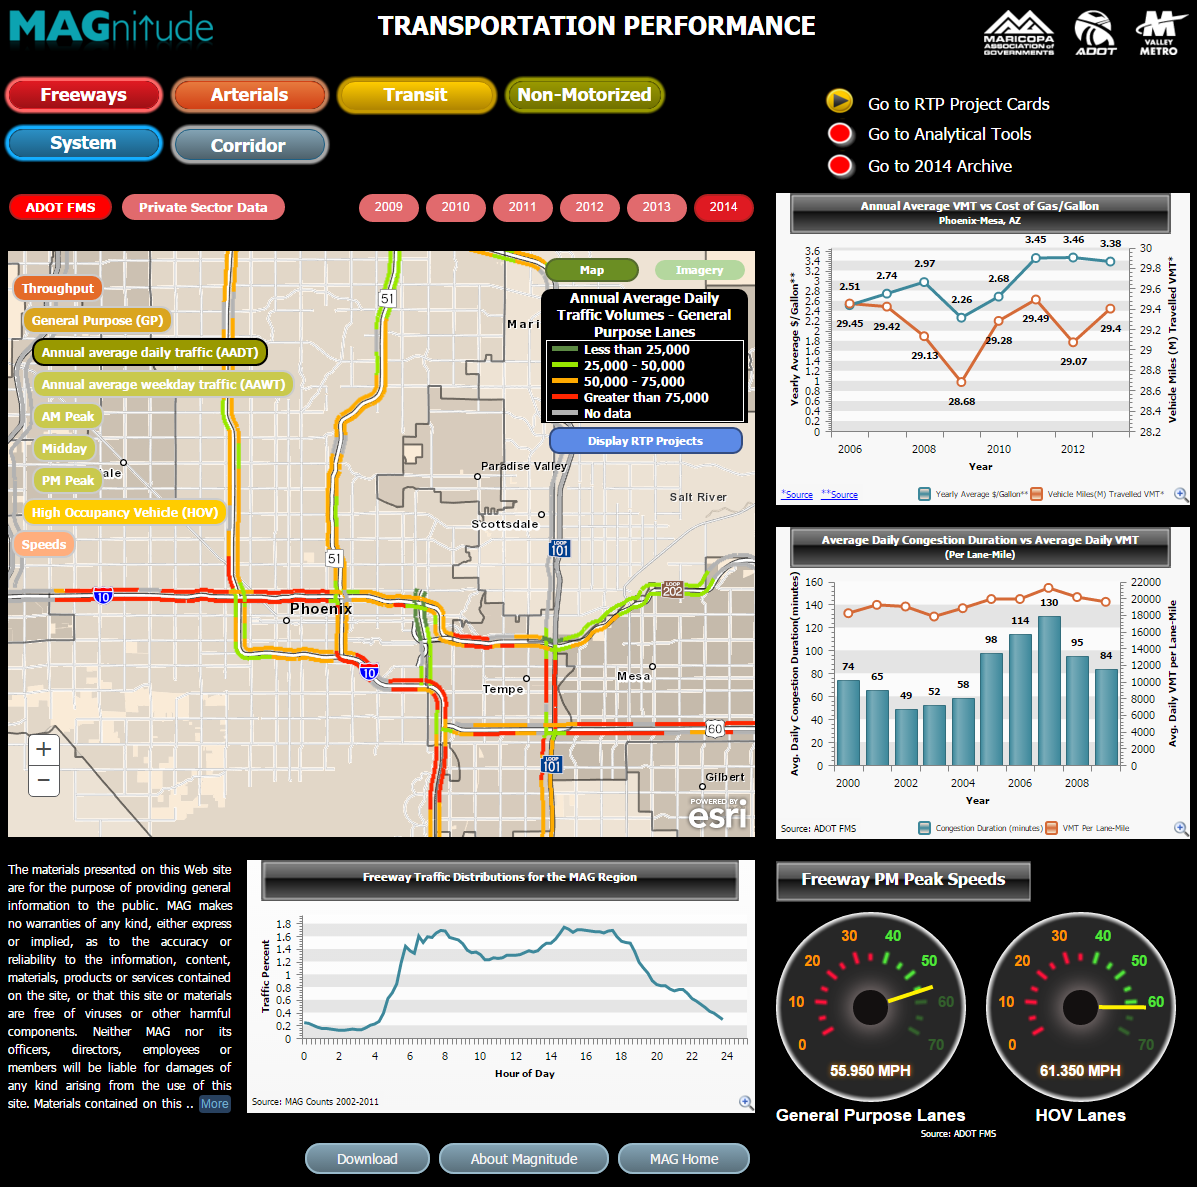
Refining: Since launching the interactive website, MAGnitude has reached many audiences and received constructive feedback from users; as a result of many requests for data from past years, the site now includes archived data from 2009 through 2014. While the process for obtaining feedback is not formalized, such feedback information is still being used to refine reporting and communication tools for future use.
Automating: Staff understand the limits of automation in reporting; it is cost prohibitive to automate data processing to the point where it is accurate enough for simultaneous use by internal technical staff, member agency staff and the consulting community. MAG has developed automated data analytics, processing and quality control steps and routines with a built-in final visual check before publication on MAGnitude.
Documenting: MAG has created a technical manual that describes processing steps to make raw data usable for incorporation into the MAGnitude reporting site. This is a great example of documentation ensuring that institutional memory and noteworthy practices are not lost as a result of staff turnover.
Linkages to Other TPM Components
6.2 External Reporting and Communication
The following steps will assist an agency in implementing an effective external reporting process to communicate transportation performance management information:
- Clarify purpose of the report
- Define roles and responsibilities
- Coordinate with external partners
- Develop reporting parameters
- Refine, automate, and document
“An overarching goal of performance management is to increase transparency and accountability of decision-making. Translating the analysis conducted as part of performance management into usable reports for legislators, stakeholders, and the public is an important component to overall success.”
Source: NCHRP Report 660: Transportation Performance Management: Insight from Practitioners
Step 6.2.1 Clarify purpose of the report
This step highlights the importance of clarity of report intent. Because external audiences will be less familiar with transportation performance management terminology and processes, it is important to clearly explain this information and why it is beneficial. To resonate with external audiences, the agency should connect activities to outcomes that are visible and relatable. Reporting to the public should focus mainly on outcome measures that resonate with the public.23
Providing context concerning legislative and regulatory requirements can be useful, but only if written in a way that focuses on aspects that the audience cares about. External audiences will not be concerned with minutiae of laws or internal agency prioritization processes, but do expect that agency resources were used effectively to address problems like congestion that are experienced by external individuals on a regular basis.
Most importantly, external reporting should effectively communicate agency goals, how and why resources were allocated in a particular way, and what results were achieved from those allocation decisions. This is critical; the public expects the agency to be an effective steward of the public money entrusted to it. The public also may not understand tradeoffs across performance areas. Agency staff should clearly communicate the budget constraints that exist and how focusing on particular areas of performance necessitates a reduced focus in other areas. This will help build support among the public for other processes, including performance-based planning (Component 03) and performance-based programming (Component 04).
Communicating to elected officials can be the most critical task for an agency, especially when making the case for additional funding.
Some approaches that may be effective include:
- Demonstrate what the agency gets in terms of performance results with different levels of funding24
- Give historical information like the effect of inflation on a fixed amount of funding25
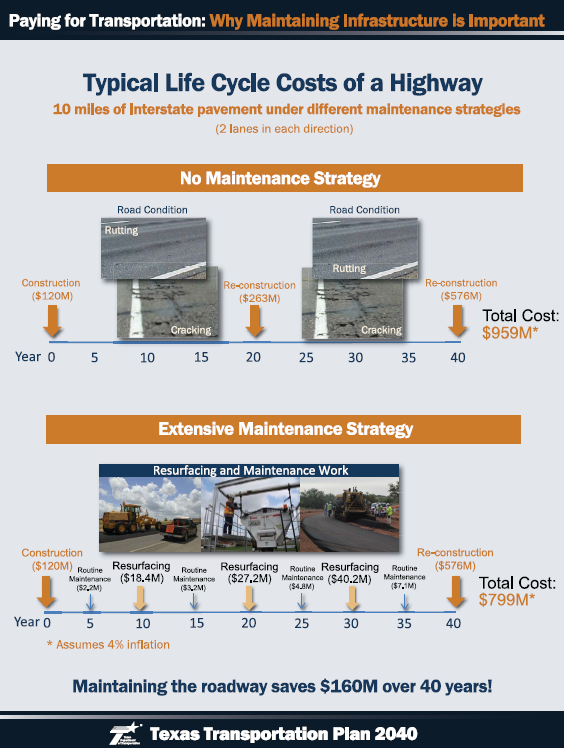
- Show savings by completing maintenance now instead of putting it off until a major expensive repair or replacement is necessary26
- Provide counterfactual info to demonstrate agency impact despite worsening conditions – congestion is increasing, but investments slowed the increase27
Examples
Oregon DOT: Communicating to a Lay Audience28
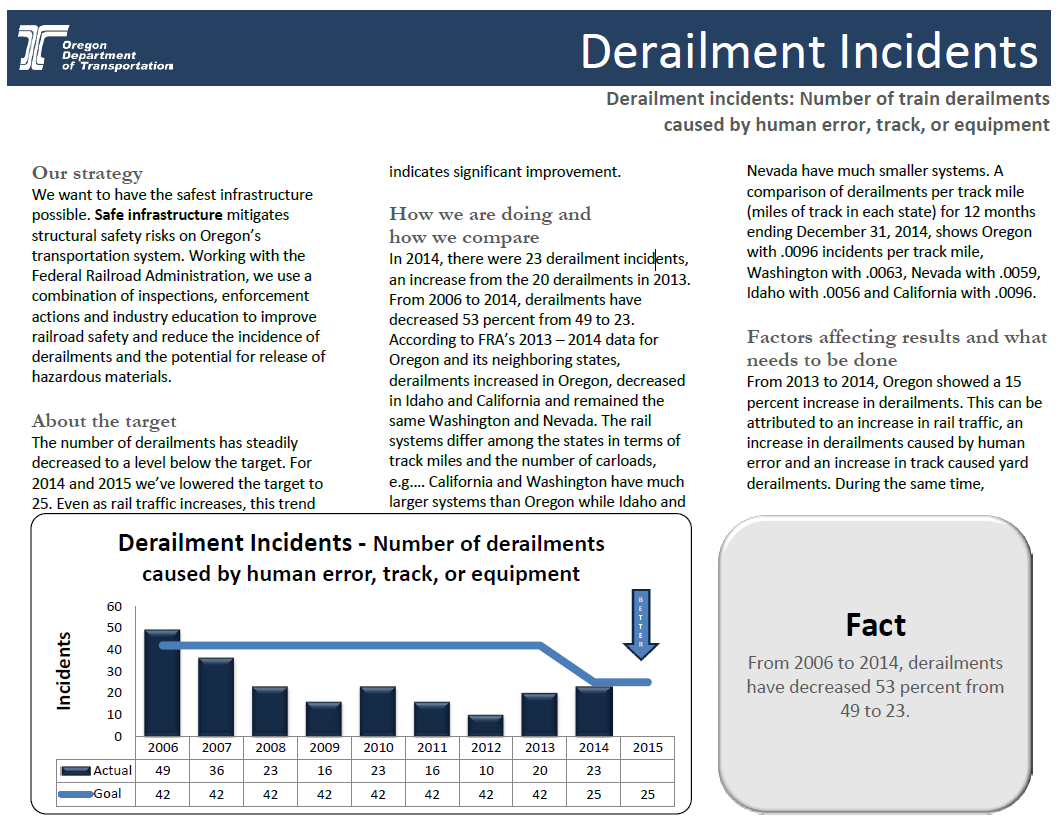
The overview page below demonstrates how the Oregon Department of Transportation seeks to communicate important information in a way that a general audience can understand. A graph shows the data so the user can get a quick sense of the trend, while the surrounding text explains agency strategy, how the target has changed over time, and benchmarks performance with peer agencies. It also includes information about what other factors might influence results to provide greater context to the agency’s activities to reduce derailment incidents. Not shown are data source, reporting frequency, and a contact person for further information. All of this information will be important to document in step 6.2.5.
Figure 6-9: Oregon DOT Derailment Reporting
Source: Oregon Department of Transportation29
weMove Massachusetts: Communicating the Impact of Funding on Performance30
As part of the first multimodal LRTP, MassDOT used an analytical tool to understand asset level performance over time. The document compared projected performance results under two funding scenarios—historical, and current funding levels that reflected an increase in state funding. This tool helped to justify funding decisions by allowing decision makers and the public to understand that, in a constrained funding environment, tradeoffs exist when funding certain areas over others. By funding certain projects, impacts on asset performance can be improved. For many of the assets, the tool demonstrated that performance would deteriorate from current conditions even with funding higher than historical levels due to the nature of asset age and deterioration curves. With further refinement and a potential web interface, this tool is intended to be effective both internally—in making funding decisions—and externally in communicating such decisions to officials and the public at large.
Figure 6-10: MassDOT Funding Scenarios and Performance Outcomes through 2023
Source: weMove Massachusetts: Planning for Performance31
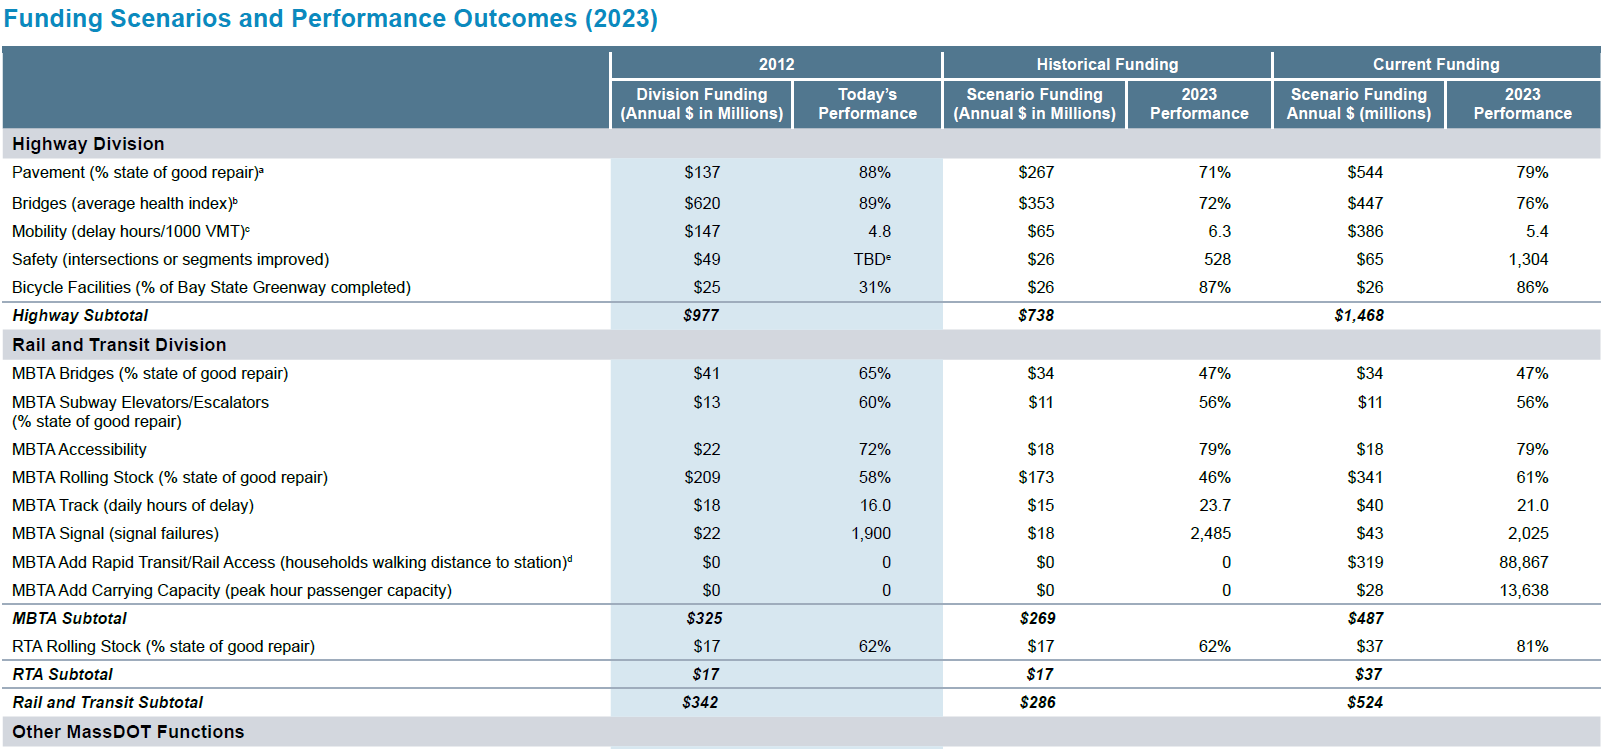
Figure 6-11: MassDOT Funding Scenarios and Performance Outcomes through 2040
Source: weMove Massachusetts: Planning for Performance32
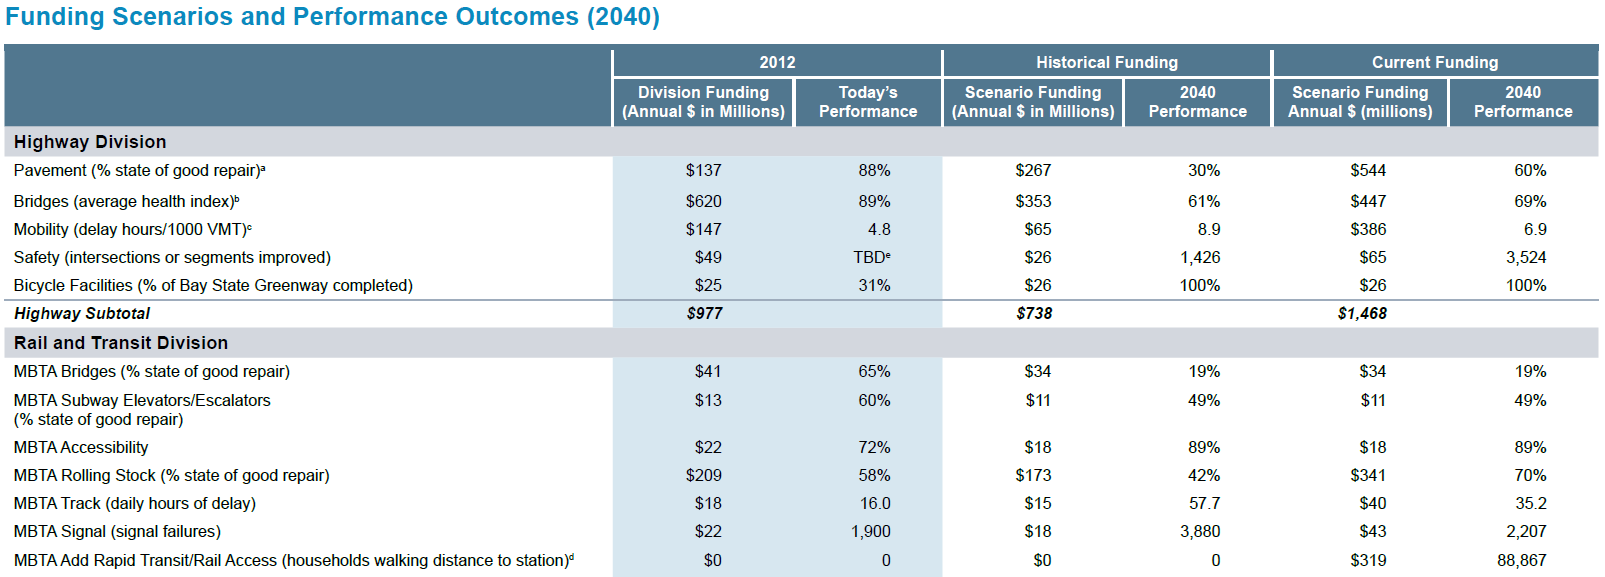
A detailed section provides information about the measures used, customer impacts, and the performance value for the years 2023 and 2040, which correspond to separate investment plan target data and the weMove planning horizon, respectively. Following this are tables (shown) summarizing and comparing performance levels currently and in the future under varying funding scenarios.
TxDOT: Communicating Maintenance Cost Savings33
The Texas Department of Transportation’s LRTP, Texas Transportation Plan 2040, includes a one-page graphical representation of the life-cycle cost savings stemming from a regular maintenance program for Interstate pavement. The comparison clearly demonstrates the importance of proactive maintenance to those not closely involved in such activities.
Figure 6-12: TxDOT LRTP Comparative Maintenance Cost Analysis
Source: Paying for Transportation: Why Maintaining Infrastructure Is Important 34
Linkages to Other TPM Components
Step 6.2.2 Define roles and responsibilities
Internal staff will need to be assigned to complete external reporting work. In many cases, the same staff will do both internal and external reporting because of the significant overlap. However, it is important to pay attention to the variations.
One important variation in this step pertains to use of reporting in stakeholder groups. Management and executive staff should be consistent in how they are speaking about performance among external groups, using the same data and context (or performance story). Some agencies establish a communications plan that lays out presentation methods, formats, and approaches to ensure messaging is consistent, unified, and cohesive across communications products. This is particularly important when reporting to decision makers, the public and other stakeholders. Internally, managers should discuss this to reduce confusion over inconsistent communication to external audiences.
Internal discussions should address:
- The effect of missing or exceeding targets and how this will be received by stakeholders, especially by those in control of funds
- How to build trust, including by reporting both good and bad performance results
- Ways to make reporting interactive
- Which staff member will track feedback over time
Examples
MnDOT: Reporting the Bad, Too35
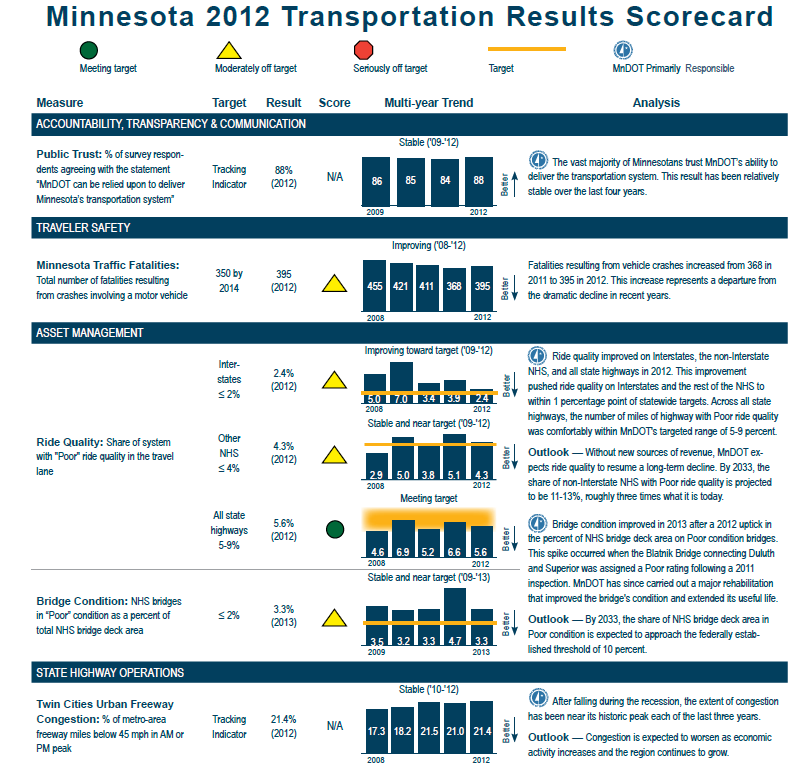
The Annual Performance Report tracks achievement relative to six objectives laid out in the Minnesota GO Statewide Multimodal Transportation Plan 2013-2032. It includes a scorecard with 17 measures the agency uses to track performance, calculate investment levels, and guide decision making. In the introduction of the report, “Highlights,” also mentions an increase in traffic fatalities and serious injuries, as well as little progress towards reducing historically high congestion in the Twin Cities area. Additionally, the list of 2012 “Challenges” is almost twice as long as the list of “Performance Gains.” MnDOT staff has chosen to be open and forthcoming with agency results, both positive and negative.
This type of report illustrates the breadth of roles required to compile the data. In the scorecard below, it is clear that distinct areas across the organization contribute to the report, including asset management, operations, and safety.
Figure 6-13: Maintaining Accountability through Transparent Reporting at MnDOT
Source: Annual Transportation Performance Report36
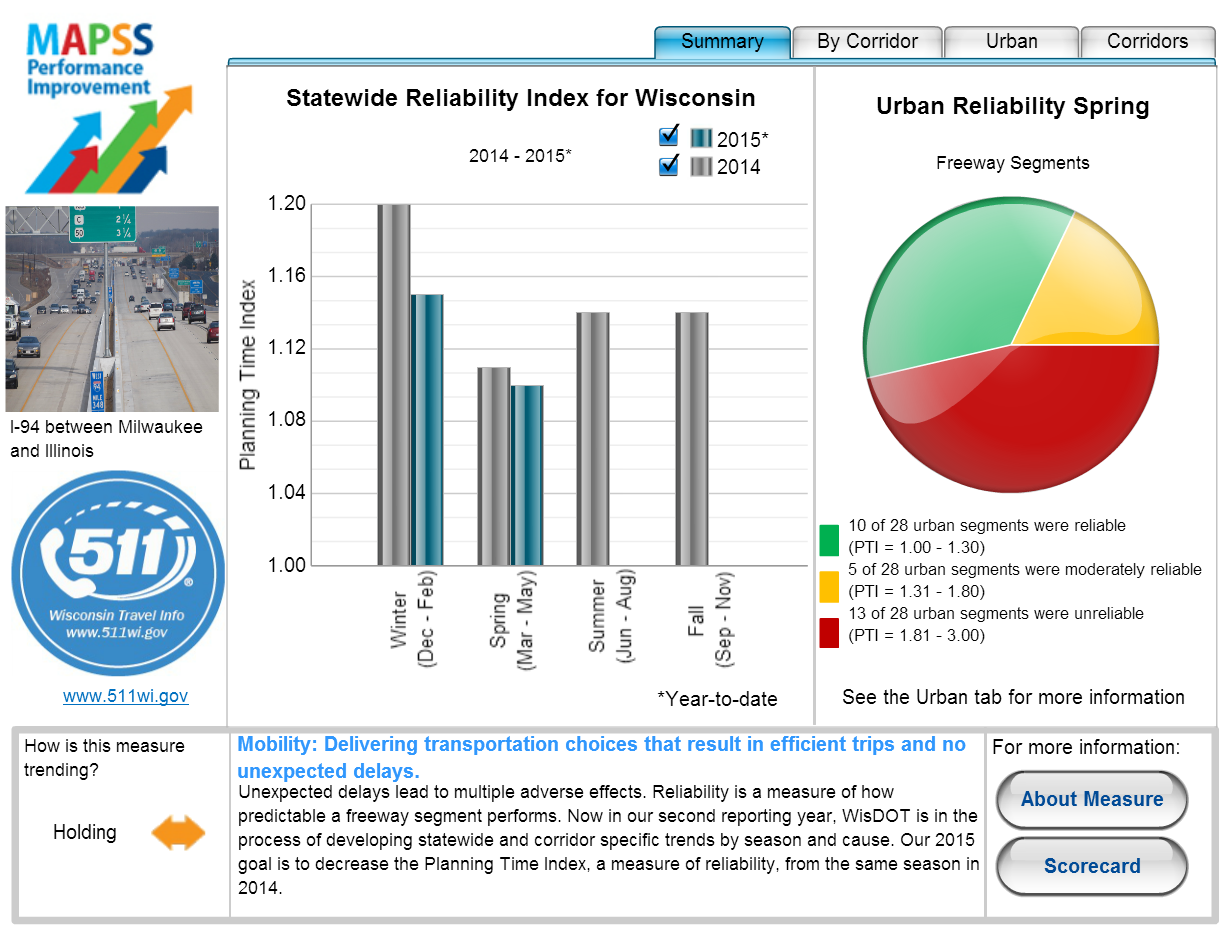
WisDOT: Interactive Reporting37
The Wisconsin Department of Transportation reports performance information quarterly using an interactive web tool coupled with a static Performance Scorecard. Users can quickly see information displayed graphically for different measures and by clicking About Measure, can link to the particular Scorecard section that provides details including target, importance, data frequency, agency Division, how the measure is calculated, influencing factors, and progress made towards attainment.
Figure 6-14: WisDOT Interactive Reporting for Public Use
Source: MAPSS Performance Improvement: Reliability (planning time index) 38
Linkages to Other TPM Components
Step 6.2.3 Coordinate with external partners
This step refers to the need for coordination with external stakeholders. Coordination speaks to the need to organize various elements within a complex environment. To appropriately tailor reporting to an external audience, the agency should coordinate with such partners. MPOs, rural transportation planning organizations, and others closely related to agency activities and outcomes will be impacted by the agency’s performance. Exceeding, attaining, or missing a target will have an effect on these groups, and this should be discussed in formation of the report. The agency should also consider how external organizations impact agency performance–do these groups help or hinder target attainment?
Alignment across stakeholders can assist agencies in target attainment, and the following general steps can promote effective coordination:
- Embrace a vision
- Set common goals
- Know the team
- Define roles and responsibilities
- Plan
- Communicate
Advocacy groups may react negatively if not consulted before final release of a report, especially if performance has not been trending in the expected or desired direction. Consultation benefits the agency by potentially reducing negative attention stemming from poor performance. However, negative attention should not be avoided by providing incomplete information, or by hiding negative results; doing so will only damage the agency’s relationship with external groups.
Because external audiences are less likely to understand intricate performance information (as discussed in step 6.2.1), it is particularly important to tell an effective performance story. Presenting data to support claims is important, but should be supplemented by narrative information that will resonate with external partners. Engagement, discussion, and communication with external stakeholders provide insight and knowledge that will position staff to best provide reporting that will be useful and actionable.
Another consideration is reporting schedule. While this will be addressed mainly in the next step 6.2.4, it is important to coordinate with reporting by partners. It might make sense to report together by bundling publications, or at least release reports at similar times.
Examples
Engage with the Media
The Washington State Department of Transportation (WSDOT) tried a new approach to engaging with media when releasing its 2015 Corridor Capacity Report. This report is the agency’s congestion report and includes statewide analysis of multimodal capacity and system performance. Instead of releasing the report to the media and the public at large, the agency decided to provide an embargoed copy to selected media in advance. This approach was well received, and enabled WSDOT to better control the story to ensure the public got the right information in an effective way. It also provided an opportunity to identify which questions the agency couldn’t currently answer, and should consider finding answers for in the next reporting round. Such a relationship with the media brings significant benefits to an agency, both in public relations and in refining future reporting.
A resulting Seattle Times article provides context surrounding the additional congestion seen since the recession, including information about lower gas prices, a recovering economy, and how the results may have influenced state legislators to support a 12-cent gas tax increase.39
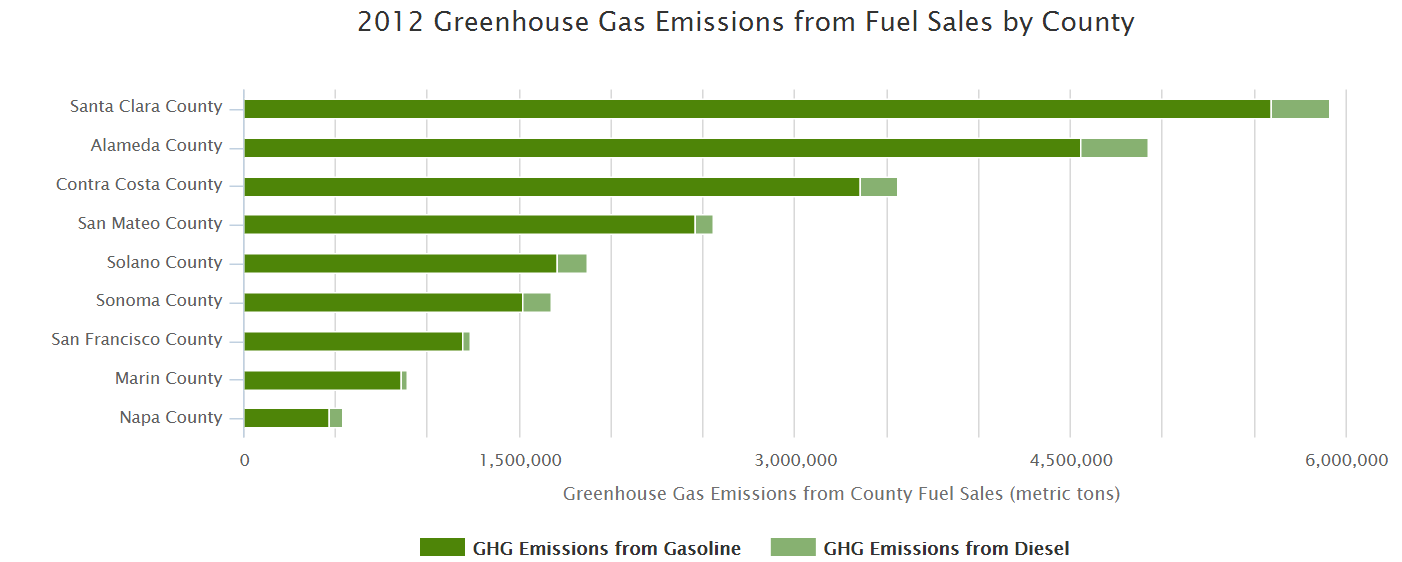
Vital Signs Report: Coordinated Reporting Across Partners40
The Metropolitan Transportation Commission, the MPO for the San Francisco Bay Area, collaborated with the Association of Bay Area Governments to write PlanBayArea, a comprehensive housing, transportation, and land use strategy document that includes the 2040 RTP. Beyond being a logical combination of integrated issues, the work was prompted by SB 375, the California Sustainable Communities and Climate Protection Act of 2008. This required that every metropolitan area draft a Sustainable Communities Strategy to reduce greenhouse gas emissions from vehicles in part by promoting compact, mixed-use development near transit. PlanBayArea is the Bay Area’s Strategy.
PlanBayArea contains a number of regional performance measures which are presented to the public via the Vital Signs portal, a user-friendly and interactive website. The format of the website gives the public a clear understanding of what the performance measures are, what they mean, and how they link to community concerns. It integrates measures from MTC, the Association of Bay Area Governments, the Bay Area Air Quality Management District, and the San Francisco Conservation and Development Commission, enabling external audiences a one-stop shop for these organizations’ reporting.
Figure 6-15: S.F. Bay Area MPO 2012 Greenhouse Gas Emissions from Fuel Sales by County
Source: Vital Signs41
Linkages to Other TPM Components
Step 6.2.4 Develop reporting parameters
Many of the same considerations discussed in step 6.1.3 for internal reporting apply for external reporting as well:
- Reporting format
- Level of detail and context
- Frequency
- Data sources
- Alignment to TPM framework
- Mandates
External reporting does not need to include information regarding the use of the report for internal evaluations. Additionally, external reporting should not include actionable information unless being used to coordinate operations with partners. Typically actionable information would only be useful to internal staff. At a transit agency for example, information on late departures from the bus depot for each driver allows management to work with particular drivers to address late departures and improve overall on-time performance. However, this information has little value to riders; they are more likely to understand and to care about overall on-time performance because it better reflects their riding experience.
Many agencies use dashboards to present data to an external audience in a way that is easy to understand. However, there is a risk of oversimplifying information by using this format, which leaves important agency reporting open to misinterpretation.42 To prevent this problem, agencies can tell a performance story (step 6.2.3) in conjunction with a dashboard. Highlight anomalies or contextual information that may explain why a target was not attained: a particularly harsh winter, legalization of marijuana significantly increasing congestion stemming from out-of-state visitors, etc. This will help external groups understand the greater context involved. When selecting a format to use, review other reports the agency has made to external groups. If there is a format that is already familiar to these audiences, it may make sense to continue using the same format for ease of use and consistency.
Some agencies push to have complete reports ready for the beginning of the legislative session as a way to make the case for additional funding. This approach can be effective if performance has been improving due to past funding increases, or if performance has declined and the agency can connect lack of funding to poor performance results.
Consider how performance data will be presented:
- Actual v. Competitor Actual
- Actual v. Target
- Actual v. Plan
- Actual v. Prior Month
- Actual v. Prior Quarter
- Actual v. Prior Year (particularly for long-term targets)
- Actual v. Same Month Last Year
- Actual v. Same Quarter Last Year
Examples
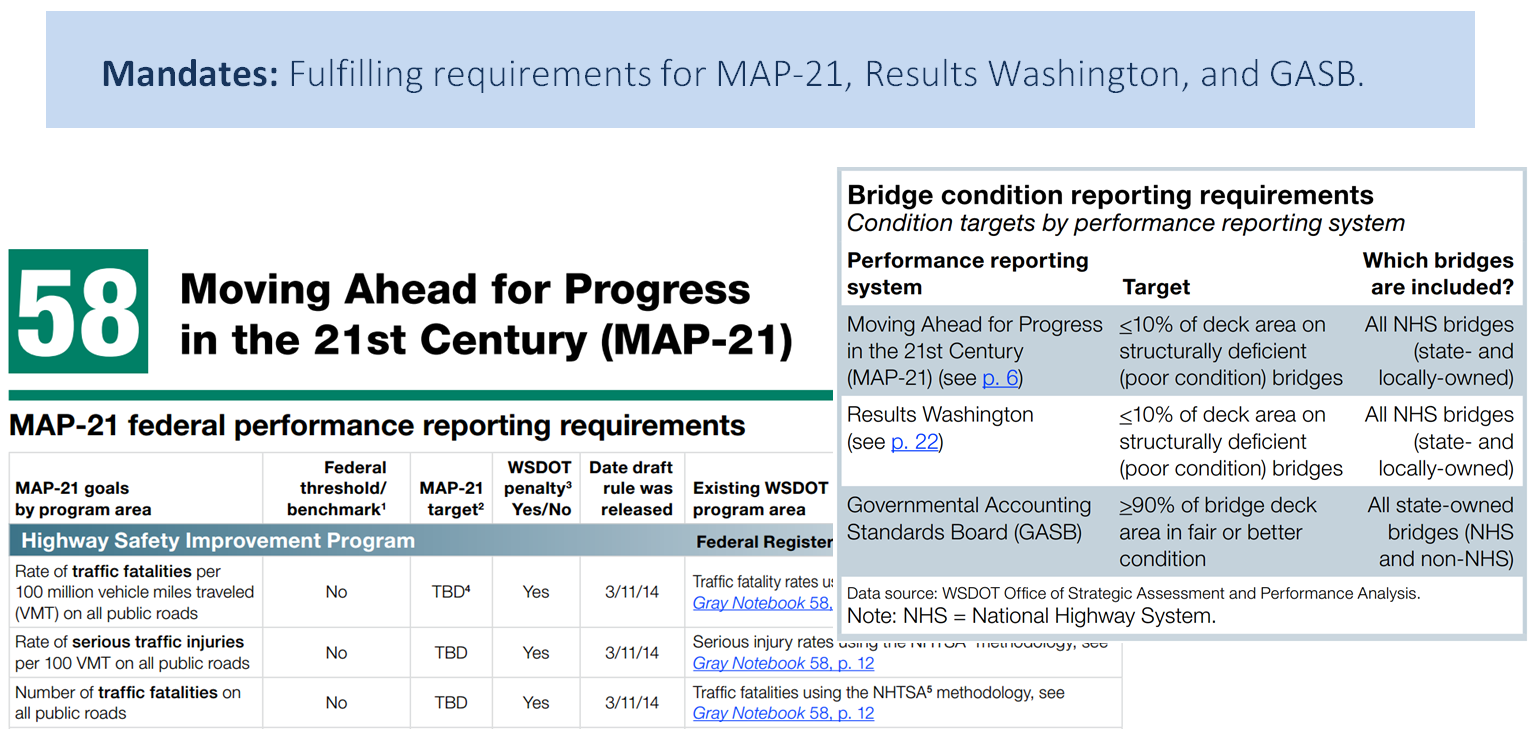
WSDOT: The Gray Notebook43
The Washington State Department of Transportation produces a quarterly performance report called The Gray Notebook that serves as an excellent example of external reporting.
Figure 6-16: WSDOT Gray Notebook
Source: The Gray Notebook Volume 5844
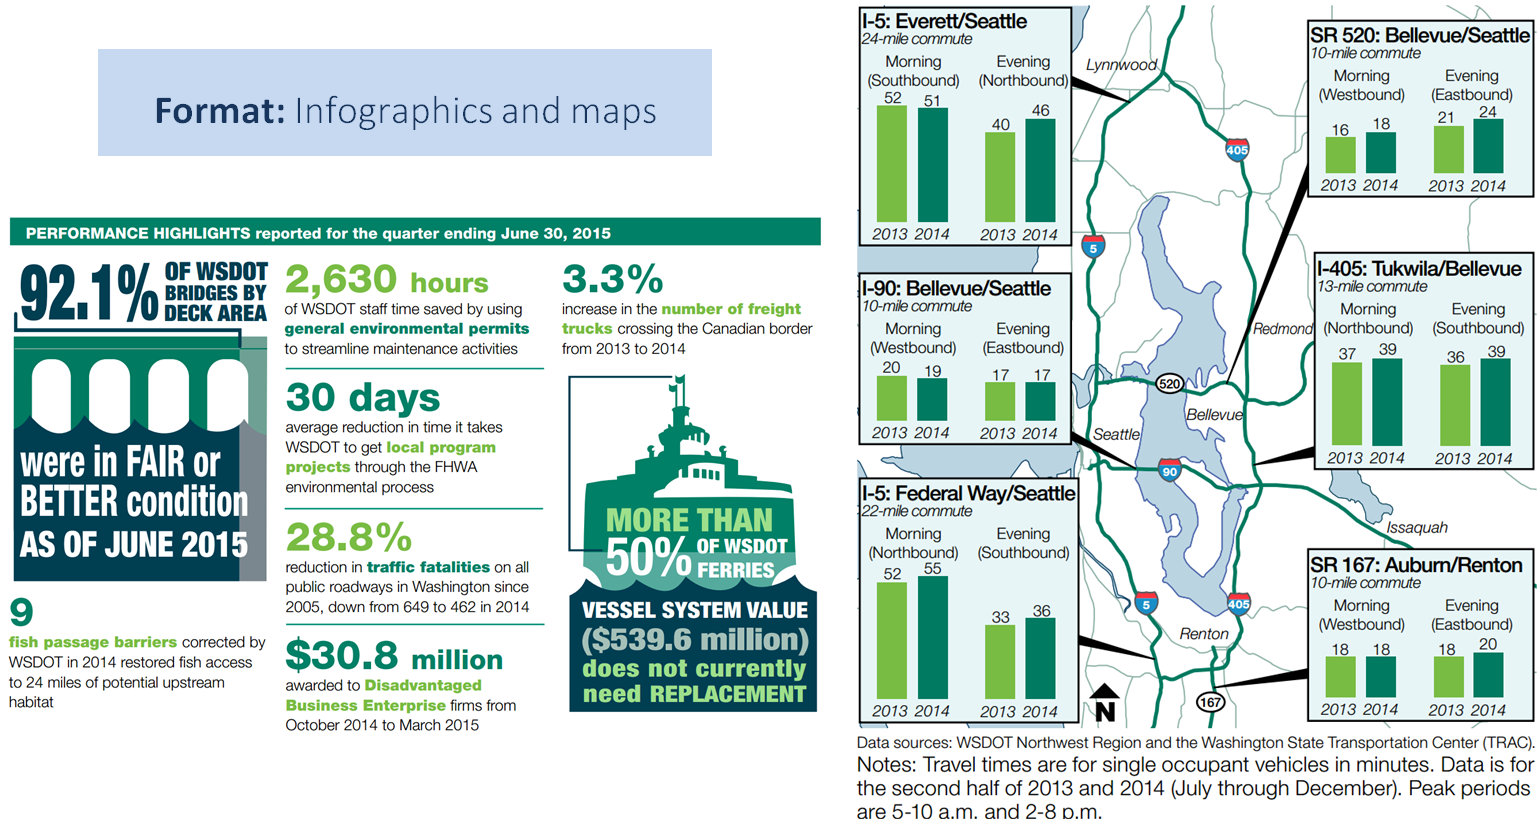
Figure 6-17: WSDOT Gray Notebook
Source: The Gray Notebook Volume 5845
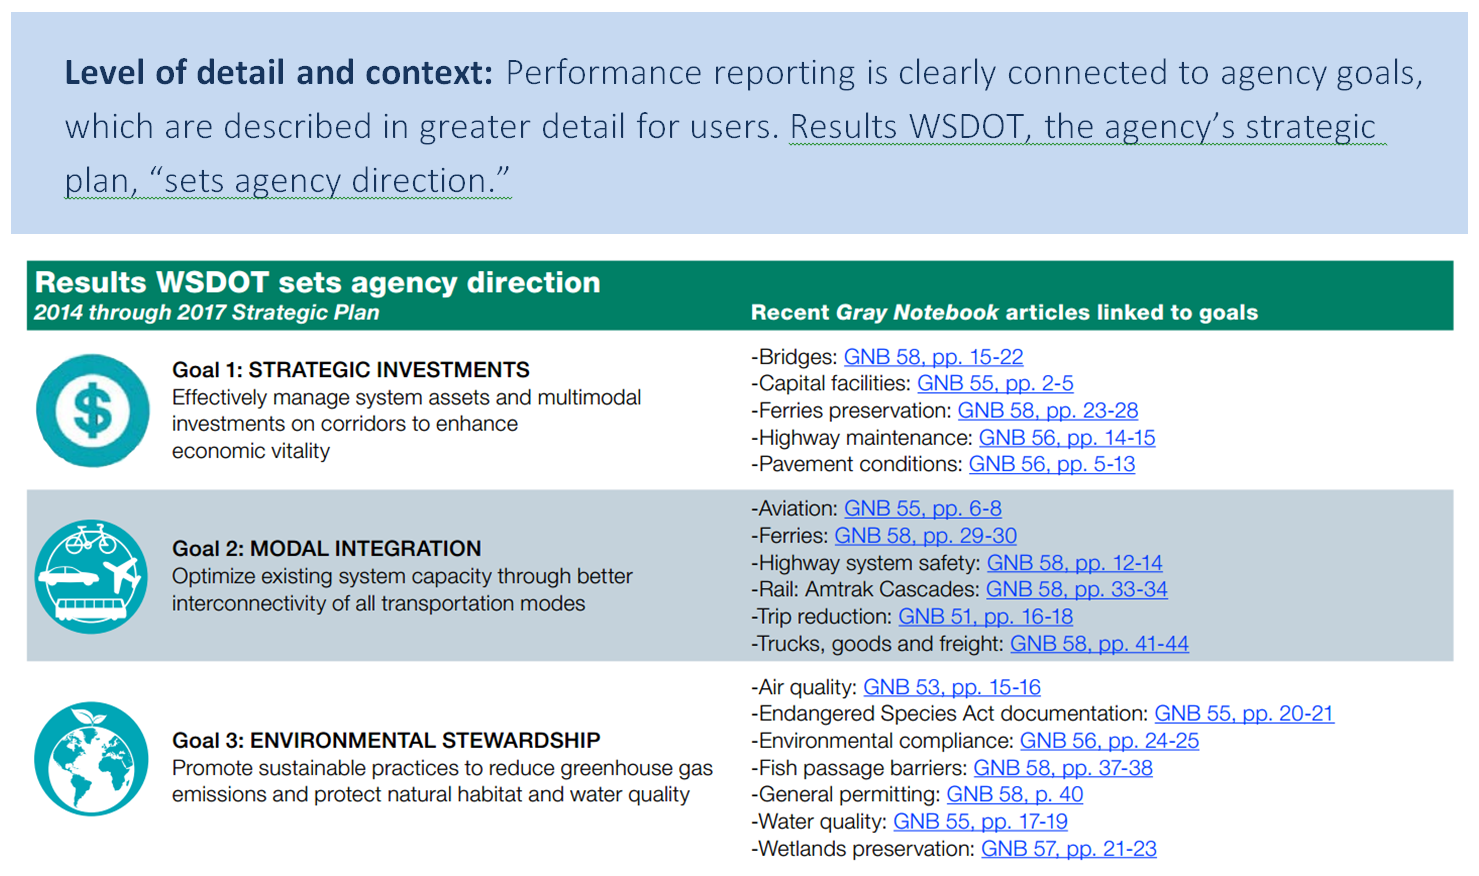
Figure 6-18: WSDOT Gray Notebook
Source: The Gray Notebook Volume 5846
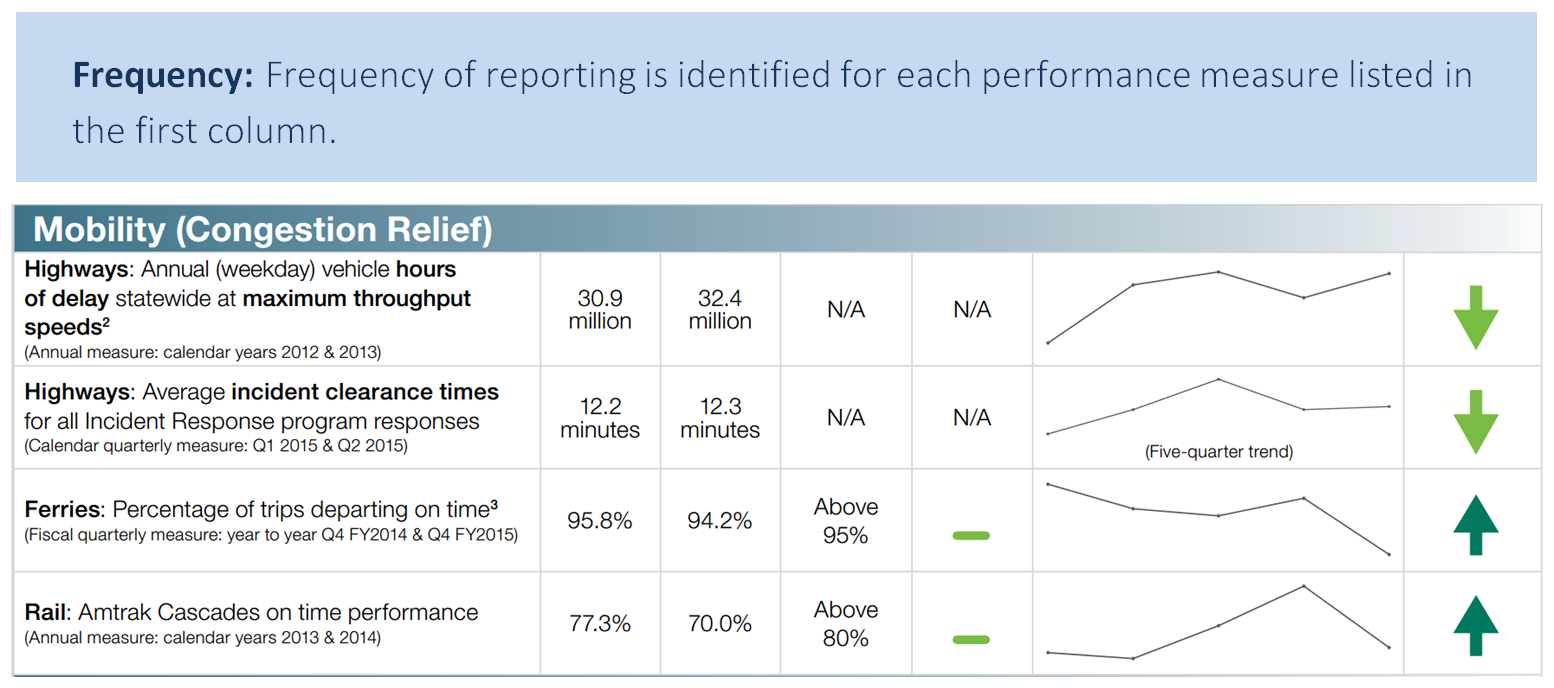
Figure 6-19: WSDOT Gray Notebook
Source: The Gray Notebook Volume 5847
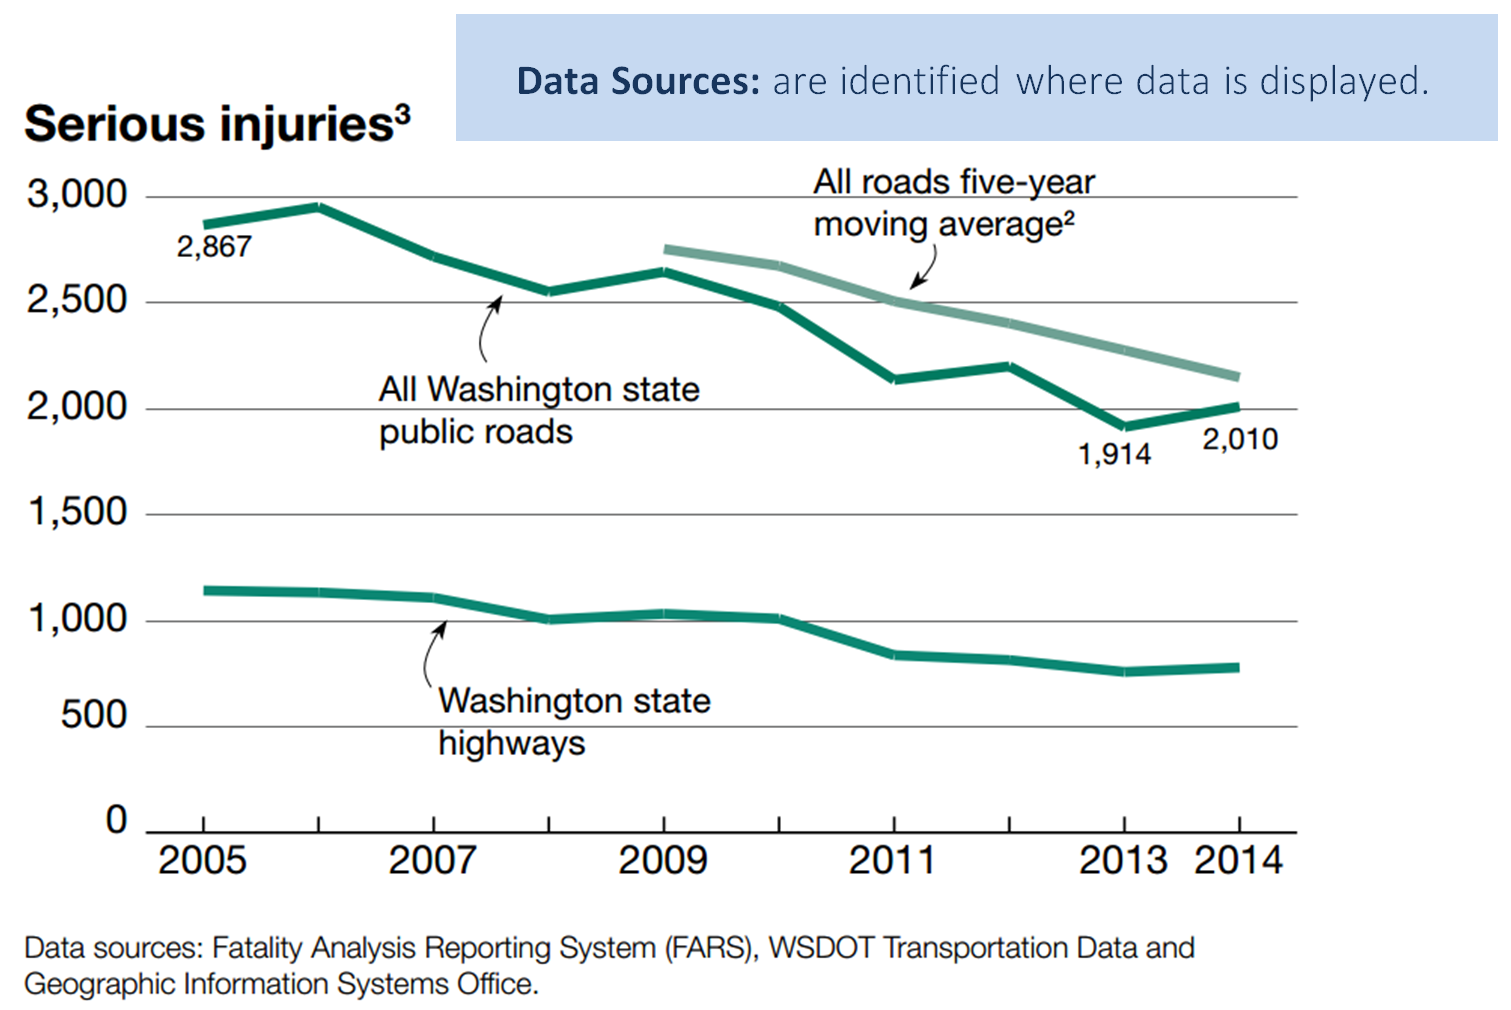
Figure 6-20: WSDOT Gray Notebook
Source: The Gray Notebook Volume 5848
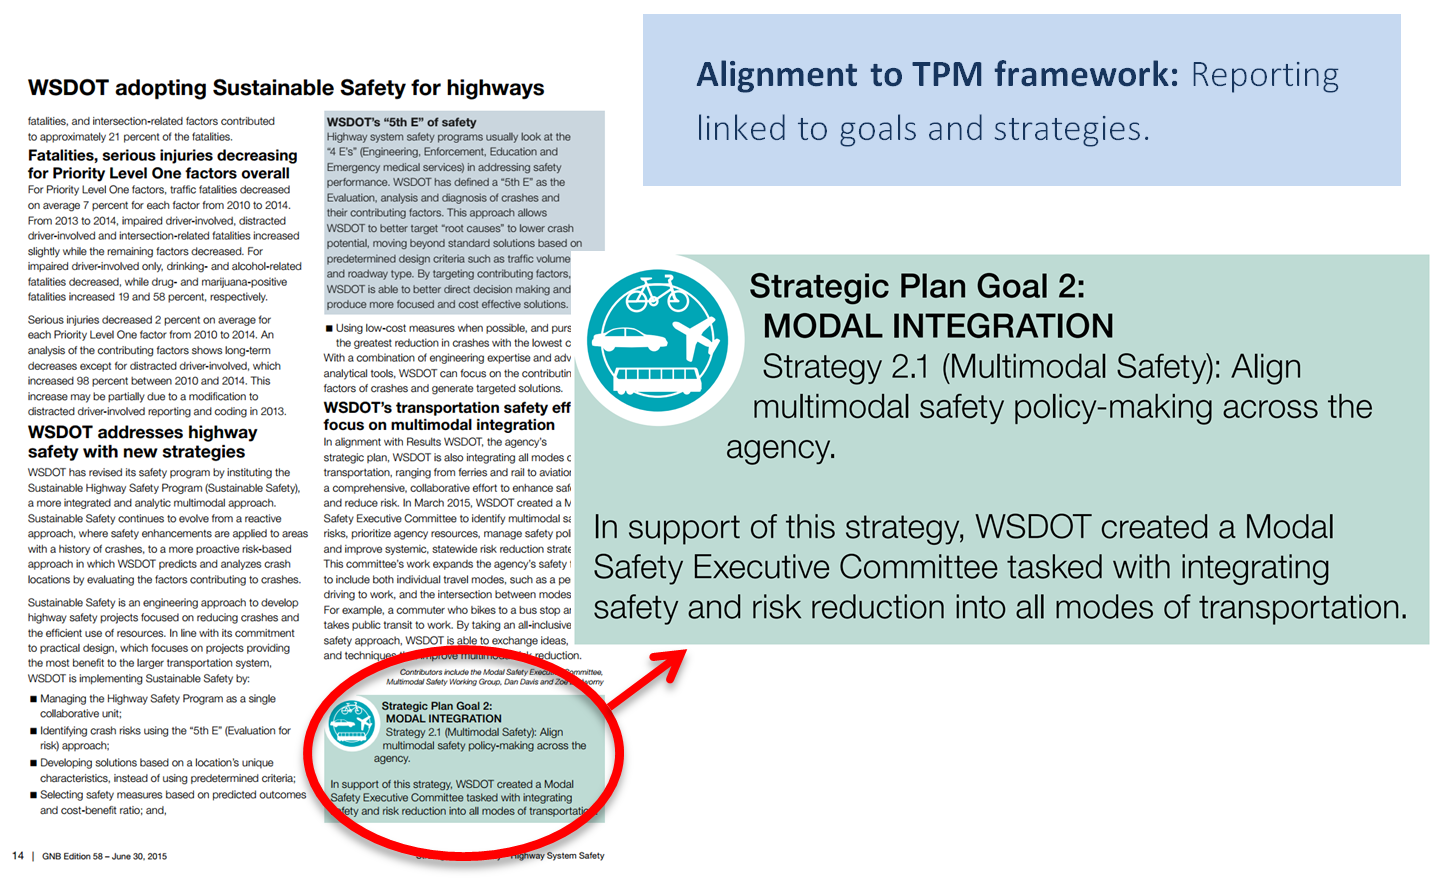
Figure 6-21: WSDOT Gray Notebook
Source: The Gray Notebook Volume 5849
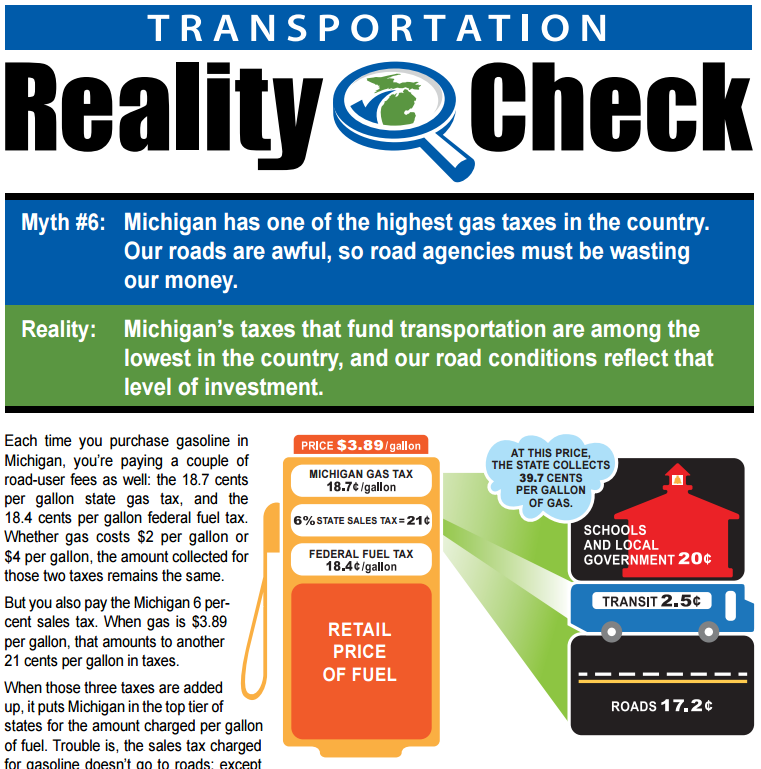
Michigan DOT: Communicating Context50
To provide greater context around agency performance, the Michigan DOT created a website called Transportation Reality Check, which identifies commonly-held myths concerning the transportation system and presents factual information to demonstrate the actual situation and why it exists. Each myth is debunked with a short video and a one-page fact sheet which provide information in an easily-digestible manner. Myth #6 pertains to state taxes on gasoline and what they fund, making it clear that poor road conditions experienced by users stem from too little funding.
Figure 6-22: Michigan DOT Transportation Reality Check Public Education Initiative
Source: Transportation Reality Check51
Linkages to Other TPM Components
- Component B: External Collaboration and Communication
- Component C: Data Management
- Component D: Data Usability and Analysis
Step 6.2.5 Refine, automate, and document
Similar to step 6.1.4 for internal reporting, documentation will streamline the reporting process in the future, reducing demands on staff time.
Record things like:
- Frequency
- Data source
- Format
- Who fulfilled roles and responsibilities outlined in step 6.2.2
- Which external audience the report intended to reach
To refine external reporting efforts, feedback should be gathered from recipients across a broad range of external groups engaged by the agency. This includes the public at large, which may access performance information through the agency website. Record all feedback where staff can access it in the future. Methods, approaches, and staff assumptions should be reevaluated after each reporting round.
For external reporting, it is particularly important to explain how and why certain measures and targets were chosen. Without a clear and logical explanation, the reporting document will fail to gain credibility among external audiences. Reports should tell a performance story rather than simply reporting data.
Examples
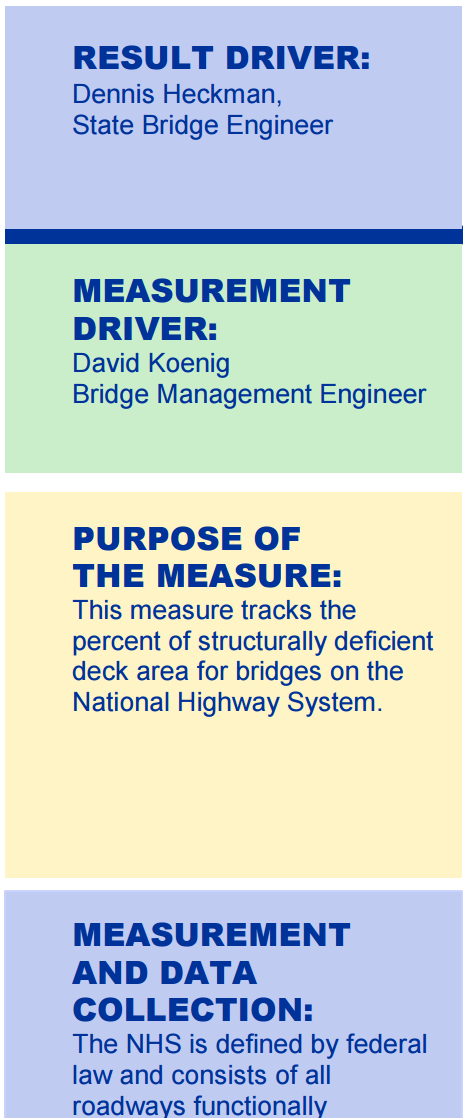
Missouri DOT: Effective Documentation
The Missouri Tracker report52 clearly documents a wealth of information, including:
- Frequency of reporting, by measure
- Staff members responsible for measure (result driver, measurement driver)
- Purpose of the measure
- How data is collected
All measures used within the agency are summarized at the beginning of the report, which also serves as a table of contents to guide users to detail pages produced for each measure. Detail pages include the side panel pictured here, as well as trend graphs, narrative description, and data source.
Figure 6-23: Missouri Tracker Documentation
Source: Tracker: Measures of Departmental Performance53
Maricopa Association of Governments
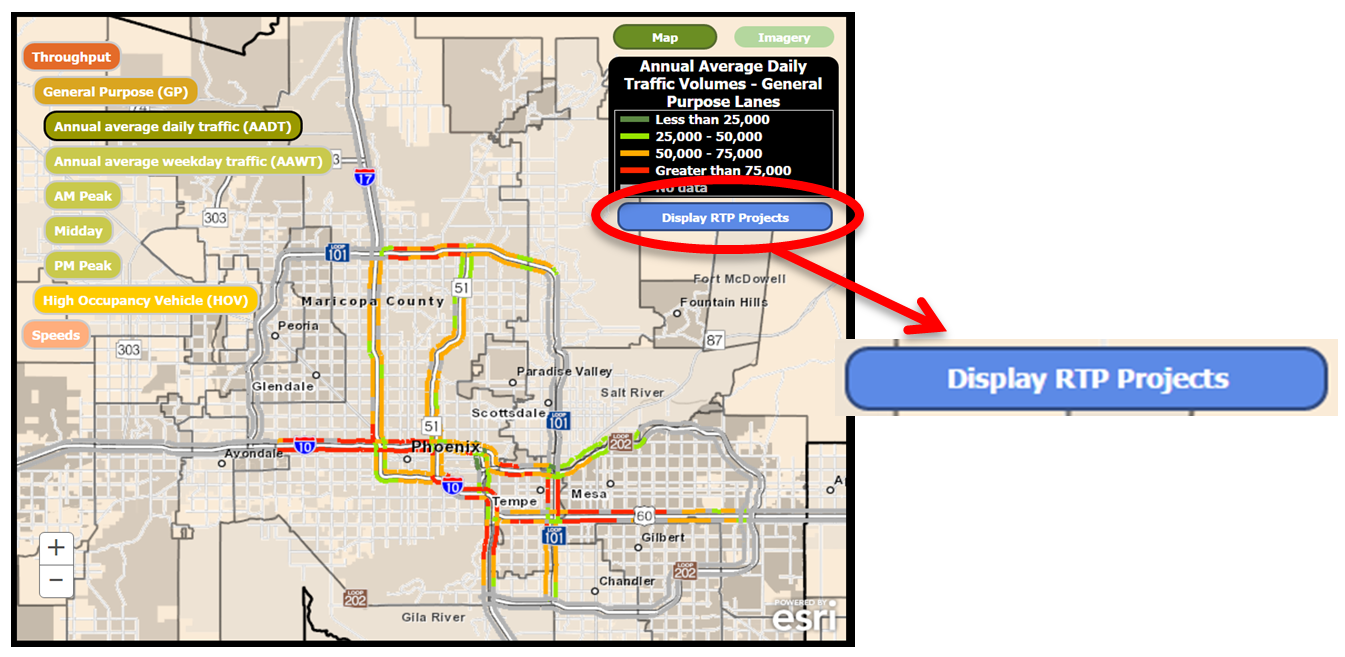
The MAGnitude reporting site discussed earlier has been refined not only based on internal feedback, but from external feedback as well. Member agencies and consultants routinely requested additional information about how projects from the Regional Transportation Plan relate to performance results. MAG staff fulfilled their request by incorporating project information into the interactive map on the site.54
Figure 6-24: Tracking Public Investment in Transportation Infrastructure at MAG
Source: MAG Performance Measurement55
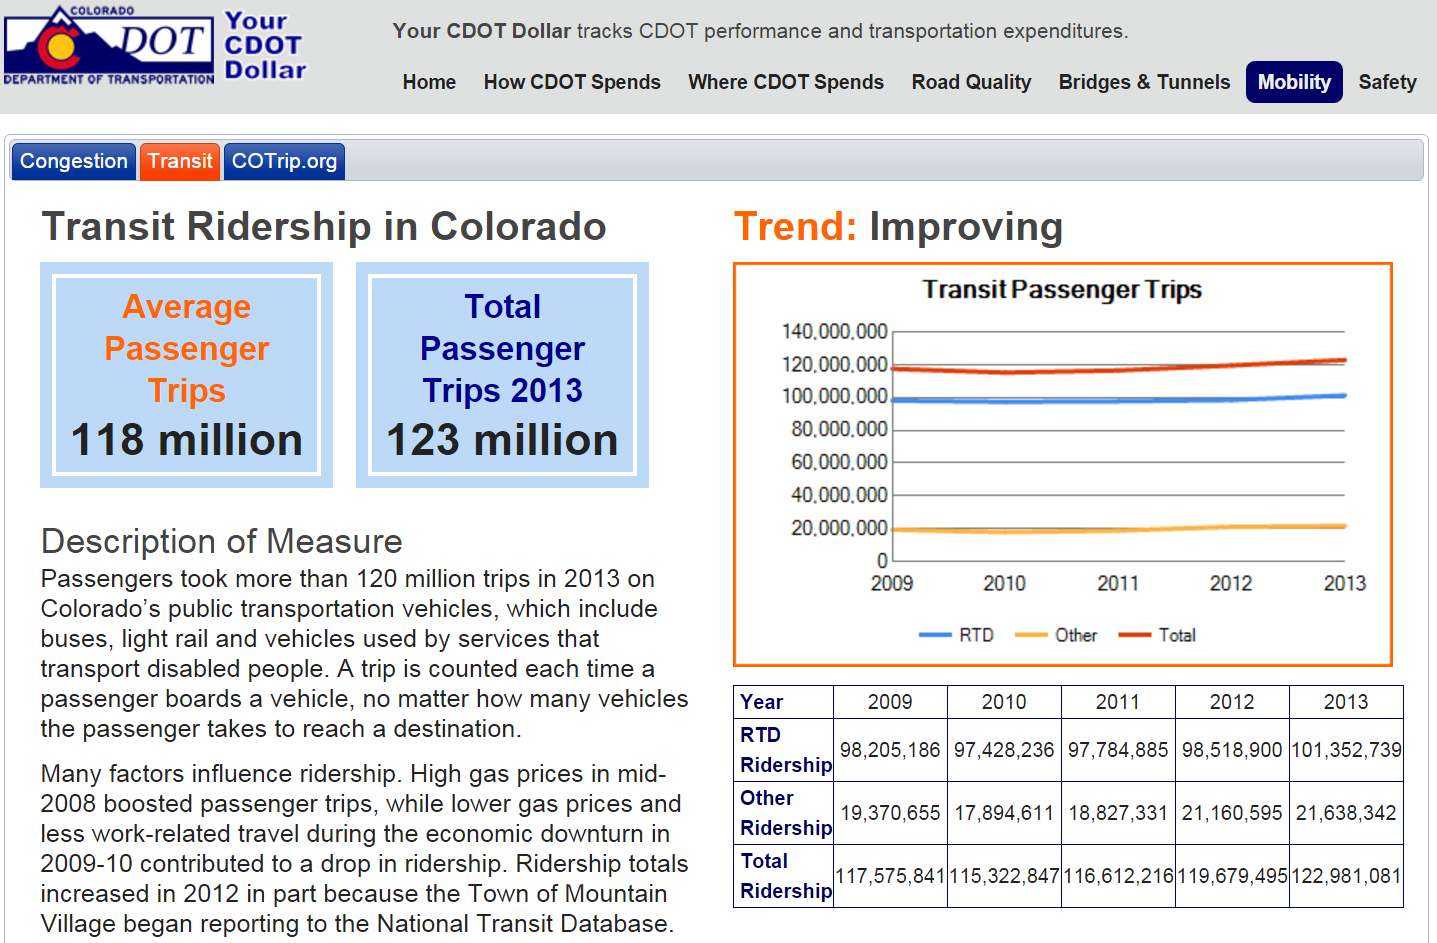
Your CDOT Dollar: Explaining Measures56
In addition to graphically displaying performance and grading results on a letter scale, the Colorado DOT provides information about how a measure is calculated. For transit ridership, the description informs the user that a trip is counted each time a passenger boards a vehicle. Because measures are often calculated differently across different agencies, this is critical information to have to fully understand the performance results being displayed.
Figure 6-25: Public Transportation Ridership Reporting at CDOT
Source: Your CDOT Dollar57