Component C
Data Management
Implementation Steps
C.1 Data Quality
Enhancing data quality processes can provide an agency with more accurate, complete, consistent, and timely data. Improving data quality improves the credibility and value of data analyses and in turn decision making based on these data. The following section outlines steps agencies can follow to implement a sustainable data quality management program.
- Establish data quality requirements and metrics
- Create data validation rules
- Develop quality management processes
“Data is needed to create information, which is used by knowledge workers to do their jobs. The right knowledge used by the right worker can turn into wisdom. Without quality data, information and knowledge are suspect and wisdom is unattainable.”
Source: Minnesota Department of Transportation, Data Business Plan.
Step C.1.1 Establish data quality requirements and metrics
Data quality is assessed with respect to a particular set of business needs. Data considered adequate for reporting on system-wide performance may not be sufficient for impact assessment. While agencies generally seek to collect data once and use it multiple times for different purposes, it should be recognized that this means the data must meet quality requirements of the most demanding business use. Analyzing the cost to achieve the various quality standards and the associated business value is critical.
Once the business purpose(s) for data have been identified, quality requirements can be defined. The table below includes a set of data quality characteristics that can be used to consider requirements and develop quality metrics.
- Data accuracy refers to the match between the data and real-world conditions. Assessing data accuracy frequently requires defining a set of validation rules for a data set, as well as measuring the number of errors (records not meeting the rules) and establishing a maximum acceptable error rate. However, this accuracy assessment method can miss many errors, i.e., data may be in acceptable ranges but still not be correct. Therefore, independent verification processes are needed to gain a true measure of accuracy. These may involve an independent re-collection of data for a sample of records, or cross checks against an independent source (if available). An accuracy metric can be established based on the percent of independently verified records that match the original record.
- Data completeness refers to the extent to which a data set provides the intended (or required) degree of coverage and whether it includes values for attributes that are considered essential for a particular business purpose. For some types of data, the assessment of coverage is straightforward. For example, one can determine the percentage of National Highway System (NHS) mileage covered by a pavement data set. For other types of data, the assessment of coverage can be more challenging. For example, it is not easy to tell whether a crash data set contains all crashes that occurred that meet established reporting criteria.
- Data consistency refers both to consistency of records within a data set and across data sets that have been independently collected. Internal inconsistencies may result from lack of standard data collection processes. For example, there may be inconsistencies across bridge inspection records within a data set due to insufficient inspector training, leading to varying interpretations of attributes. Inconsistencies across data sets may be due to use of different methods or data definitions. In another example, pavement condition data for the state highway network may have been collected using automated crack detection methods, whereas a local pavement condition data set may have been based on visual crack observations. This inconsistency could make it difficult to create a consolidated report on pavement condition on the NHS. Another common issue related to data consistency is changes to attribute definitions or measurement methods over time. Lack of consistency in attributes, attribute definitions, and collection methods can pose barriers to use of data for baseline development, trend analysis and benchmarking. Consistency can be assessed and improved by developing and documenting clear data standards, covering definitions, measurement methods, formats, and valid value ranges.
- Data timeliness refers to the amount of time that it takes from collection of the data to making the data available for use. Timeliness can be improved through automation, ensuring sufficient staff resources to perform collection and processing tasks, and streamlining of review and approval processes (within and across agencies). There may be practical constraints on resources for data collection, quality assurance and processing activities that limit timeliness improvement. Data currency is a related concept that represents the extent to which a data set represents current conditions. For example, a requirement for data currency might be that all bridge condition records reflect inspections completed within the last two years.
Source: Federal Highway Administration
| Characteristic | Measurement Considerations |
|---|---|
| Data accuracy |
|
| Data completeness |
|
| Data consistency |
|
| Data timeliness/data currency |
|
Defining data quality requirements and metrics involves tradeoffs. For example, an agency may decide to release data that is 80% accurate – based on a realization that getting data to near 100% accuracy would require so much time and effort that the data would no longer be valuable by the time it was released. High quality data requires investments in the data itself, and in processes to measure, track and address data quality. An independent verification process can be essential to ensure data accuracy, but requires additional effort beyond the primary data collection. Some agencies choose to view the cost of quality assurance as an integral part of the base data collection cost.
Examples
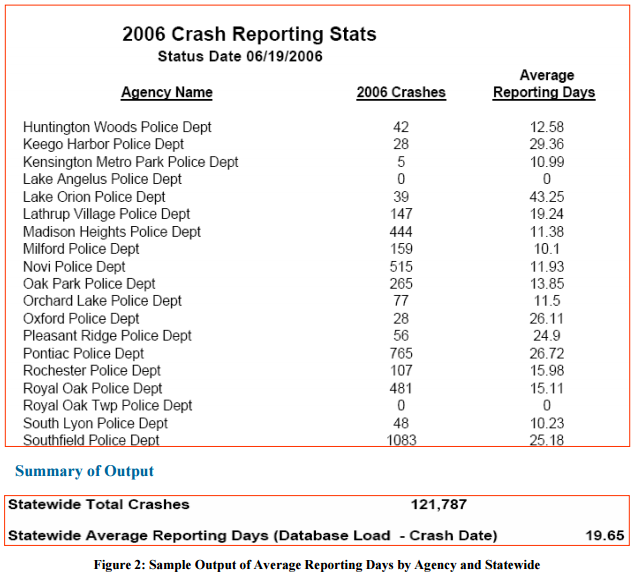
Crash Data Improvement Program Guide: Federal Highway Administration4
FHWA developed the Crash Data Improvement Program (CDIP) Guide to “assist state crash database managers and other traffic safety professionals in identifying, defining and measuring the characteristics of the data quality within the state crash database.” The CDIP Guide focuses on crash data timeliness, accuracy, completeness, consistency, integration, and accessibility. For each of these elements of data quality, the Guide provides ways to develop a metric and assess performance, and provides examples of metrics.
Examples for each are provided below:
- Timeliness: Average reporting days (number of days between crash occurrence and database entry)
- Accuracy: Average number of errors per crash report
- Completeness: Percent of crashes located (i.e., placed at a specific point on the road system)
- Consistency: Percentage of local agencies using the statewide standard crash report form
- Integration: Number of agencies locating safety events using a specified tool (enabling linkages between crash and roadway files)
- Accessibility: Percent of local agencies using the online crash data system for data retrieval and reporting
Figure C-2: Crash Reporting Data Aggregation
Source: Federal Highway Administration
Linkages to Other TPM Components
- Component 02: Target Setting
- Component 05: Monitoring and Adjustment
- Component 06: Reporting and Communication
- Component D: Data Usability and Analysis Capabilities
Step C.1.2 Create data validation rules
Data validation rules can be established to assess accuracy, consistency, and completeness. Data validation rules are best established through a collaborative effort between subject matter experts with an understanding of the data and data uses, and data managers who understand how to translate the rules into precise language required for automation.
Rules can be defined to specify:
- Valid ranges for numeric attributes
- Valid lists of values for coded attributes
- Invalid combinations of attribute values (e.g., a flexible pavement cannot have faulting)
- Conditions under which null values are acceptable for different attributes
- Acceptable changes from an earlier observation (e.g., an improvement in bridge condition without an intervening maintenance or rehabilitation action)
- Comparison of aggregate quantities for a data set to a standard (e.g., record count matches expectation; mileage sums to an appropriate value given the expected data set coverage)
Data quality checks are best implemented as part of a data collection or data entry process so that problems can be detected and corrected early on. Where this is not practical, validation rules can be applied to existing data sets. This can be accomplished as a series of queries, or implemented via data profiling and cleansing software.
Manual review of data can be helpful to elicit ideas and suggestions for validation. An iterative approach can be taken involving implementation of basic validation rules and then manual review to refine the existing rules and identify additional rules.
Examples
Quality Analysis Software: Virginia Department of Transportation5
Virginia DOT (VDOT) uses over 95 rules to validate data as part of its Traffic Monitoring System Raw Data Error Review Process. Automatic review software uses these rules and data comparisons, and assigns quality ratings to the data along with advisory messages. These ratings and messages can then be reviewed manually, and updated where appropriate. The table below describes the icons used to depict four levels of message urgency for quick recognition.
VDOT started using the software around 1998-1999, and has refined the process over time. The agency adds new tests to the review process when staff analyzes the data or troubleshoots hardware and equipment issues. The agency has found value in new calculated data comparison. VDOT has also developed an automated review process to review specific data instead of the full data to avoid meaningless review results. Several years ago VDOT color-coded the date selection calendar in order to provide users and managers with a quick indication of data existence, review status, and the health of the data collection.
Source: Federal Highway Administration6
| Icon Level | Icon Description | Icon Meaning |
|---|---|---|
| 1 | A question mark in a green circle. | An advisory of a questionable nature. |
| 2 | A lowercase letter I in a blue circle. | An informational advisory. |
| 3 | An exclamation mark in a yellow triangle. | A warning level message. |
| 4 | An X in a red circle. | An error level message. |
Linkages to Other TPM Components
Step C.1.3 Develop quality management processes
Data quality management is an ongoing process for ensuring that data meet established quality requirements. Continually improving data quality can increase data value, leading to improved decision-making at an agency. Developing quality management processes can help ensure that data quality remains an ongoing priority after initial data acquisition efforts.
Establishing a data quality management process involves:
- Documenting data quality requirements and their business justification
- Defining steps that will be taken to assess agency data to determine whether the data meet data quality requirements
- Defining steps that will be taken to improve quality of both existing data and of new data that the agency will acquire in the future
- Establishing roles, responsibilities and deliverables for each step
- Developing a calendar of data quality activities
- Budgeting for sufficient staff time and contractor resources to accomplish each step
- Obtaining feedback on data quality processes and using this feedback to improve efficiency and effectiveness
Specific activities to consider for inclusion in a performance data quality management plan include:
- Data collection staff training
- Data collection equipment specification and calibration
- Certification processes for both staff and equipment
- Continuous data quality audits
- Independent validation processes
- Acceptance criteria for new data sets (incorporated into data collection contracts where appropriate)
- Modification of data entry applications to build in lists of values and data validation rules.
- Automation of data validation and cleansing processes
- Provision of mechanisms for data users to report errors
- Use of supplemental data sets to fill in gaps in the primary source (e.g., blending of travel time data from different sources)
- Creation of applications that facilitate quality review, e.g., review of historical data at a location, or review of tabular data against imagery or other data sources for a location
Examples
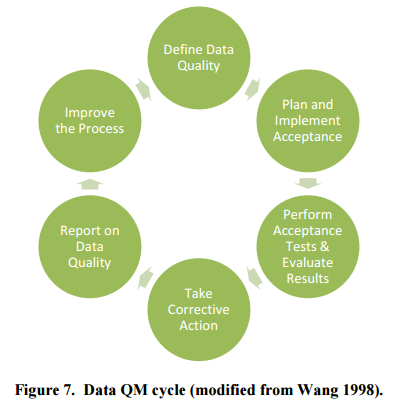
Guide to Quality Management Processes for Pavement Condition Data: Federal Highway Administration7
FHWA developed the “Practical Guide for Quality Management of Pavement Condition Data Collection” in 2013. The report includes a quality management cycle for pavement data. The cycle involves six steps and includes feedback, with continual data evaluation and process evaluation.
Figure C-3: FHWA Pavement Condition Data Quality Process
Source: NCHRP Report 8148
Michigan Department of Transportation’s Intermodal Management System
Michigan DOT Intermodal Management System (IMS) business processes define data needs and accuracy, completeness, and timeliness requirements. The system includes 54 categories of data that are assessed quarterly for quality and completeness. Quarterly data quality reports include information on data currency (update due versus actual), known flaws (e.g., missing data), and importance (e.g., used to meet reporting requirements). Data quality categories are assigned as follows on the reports:
- Green: Data are complete, correct and capable of supporting business processes
- Yellow: Data are incomplete or incorrect and could pose problems supporting business processes
- Red: Data are incomplete or incorrect and currently incapable of supporting business processes9
Linkages to Other TPM Components
C.2 Data Accessibility
To provide value for decision making, data must be available in useful forms to different audiences. Potential users need to know what data exist and how to obtain them, and understand their derivation and limitations. Ideally, information about available data and points of access for data will be consolidated within an agency to make it easier for staff to discover and use data. Ensuring accessibility to external data sources and, conversely, providing external access to agency data (where feasible and appropriate), can facilitate collaboration in performance-based planning and programming by providing a common view of historical, current and (where available) forecasted performance conditions. The following section outlines steps agencies can follow to ensure good access to data in support of transportation performance management.
- Establish requirements for different audiences
- Enhance data access methods and tools
“Findability Precedes Usability. In the Alphabet and on the Web. You Can’t Use What You Can’t Find.”
Source: Peter Morville, “Ambient Findability” (2005)
Step C.2.1 Establish requirements for different audiences
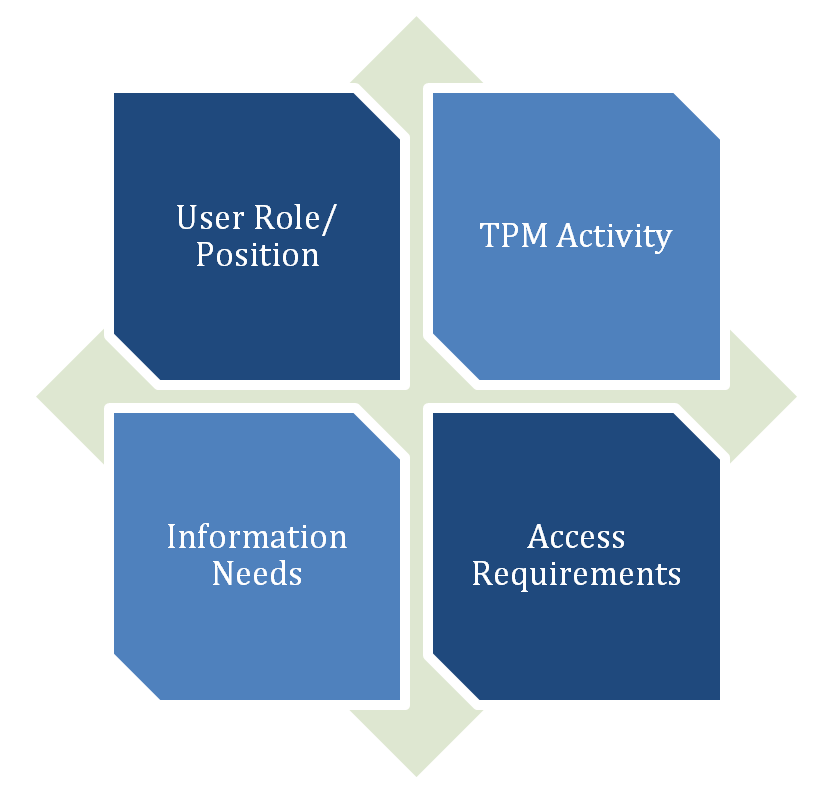
Improving accessibility of performance data begins with an analysis of requirements: who needs to see performance data – for what purpose, and in what form? One way to approach this is to develop a set of information use scenarios. Each scenario would define the type of user (e.g., performance analyst, senior agency manager, elected official), the type of TPM activity they are engaged in (e.g., target setting, strategy evaluation, reporting), what their specific information needs are for this activity, and how they would want to access this information. (Refer to the list of questions included in section 12.2.1 for typical transportation performance management information needs and analysis capabilities.)
Once a set of representative performance data use scenarios are assembled, a broader picture of data access requirements will emerge.
The following questions should be considered based on the information use scenarios:
- What data need to be accessible to external partners and what data are primarily of interest to internal agency users?
- Which types of users need to see data primarily in summary form?
- Which types of users need to have access to full data sets for detailed exploration?
- Are there standard views or reports that would address the primary needs of particular audiences?
- Which types of users have specialized analysis needs that require integration of performance data into analytical tools?
Figure C-4: Accounting for Various Audiences
Source: Federal Highway Administration
It is also important to consider how to ensure that data are sufficiently documented so that users will understand their limitations. Different audiences will require different levels and types of documentation. For example, a data analyst may want highly detailed information about a data set’s derivation, whereas a senior manager would prefer to see a few clearly marked essential highlights that facilitate their interpretation and use of the data.
Examples
Source: Federal Highway Administration
| Activity/User Type | Data Access Requirements |
|---|---|
| Performance-based planning/data analyst |
|
| Safety program development/ Program Manager |
|
| Program delivery monitoring/ District Administrator |
|
| External performance reporting/ Communications Officer |
|
Linkages to Other TPM Components
- Component 05: Monitoring and Adjustment
- Component 06: Reporting and Communication
- Component A: Organization and Culture
- Component B: External Collaboration
- Component D: Data Usability and Analysis Capabilities
Step C.2.2 Enhance data access methods and tools
Once requirements are established for data access, the agency can assess its existing data access and reporting tools, identify gaps, and plan improvements. Some improvements can be implemented within specific business units; others are more appropriate to pursue at the agency-wide level. For example, a safety analysis unit may implement specialized tools for data access and analysis, whereas an effort to build or enhance a data warehouse and business intelligence environment would typically be an agency-wide initiative. An agency-wide approach—if well planned and designed—can cost-effectively address multiple business needs with a single set of solutions.
The following data access methods and tools can be considered for implementation or enhancement:
- Make data set available for download on internal or external portal
- Make data available via an Application Programming Interface (API)
- Make spatial data layers available for display on geographic information system (GIS) portal
- Create custom fixed or interactive maps to support specific functions
- Create data mart or data “universe” for reporting – with standard reports/charts and ad-hoc reporting/charting capabilities
- Create dashboard(s) tailored to needs of different users
- Create mobile applications for display of location-aware data
When planning enhancements to data access methods and tools, there are several things to keep in mind:
- Making Data Findable – Data need not all be stored or accessed from the same place, but information about the data can be centralized to make it easy for people to find. Consider implementing a central data catalog to provide a single place to find what data sets are available and how to access them.
- Maintaining Data in Authoritative Sources – New data repositories may be created to support reporting – with integrated or transformed data. It is good practice to make sure that these repositories are used for reporting only – rather than as a secondary location for data updating. When data errors are discovered it may be easier to correct these errors directly in the repository that is used for reporting, but this creates extra work in the long term. Errors should be corrected in source systems.
- Document and Automate Data Loading – A repeatable and disciplined approach to data transformation and loading from authoritative source data systems to reporting repositories should be followed. Extract-Transform-Load (ETL) tools are available for defining and automating data transformation rules.
- Managing Data Access – Clear access policies should be established to protect sensitive data and to explicitly identify what data should be made available outside of the agency. There is a balance between maintaining confidentiality and enriching availability – policies to address this are necessary, as is oversight and an understanding of who has authority to grant access.
- Managing Metadata – Data users will want to understand the source(s) and derivation of data sets and the meaning of different data elements. It is important to have a strategy for creating, updating and delivering metadata at both the data set and data element level. As noted above, different types of audiences will want to see metadata at different levels of detail.
Examples
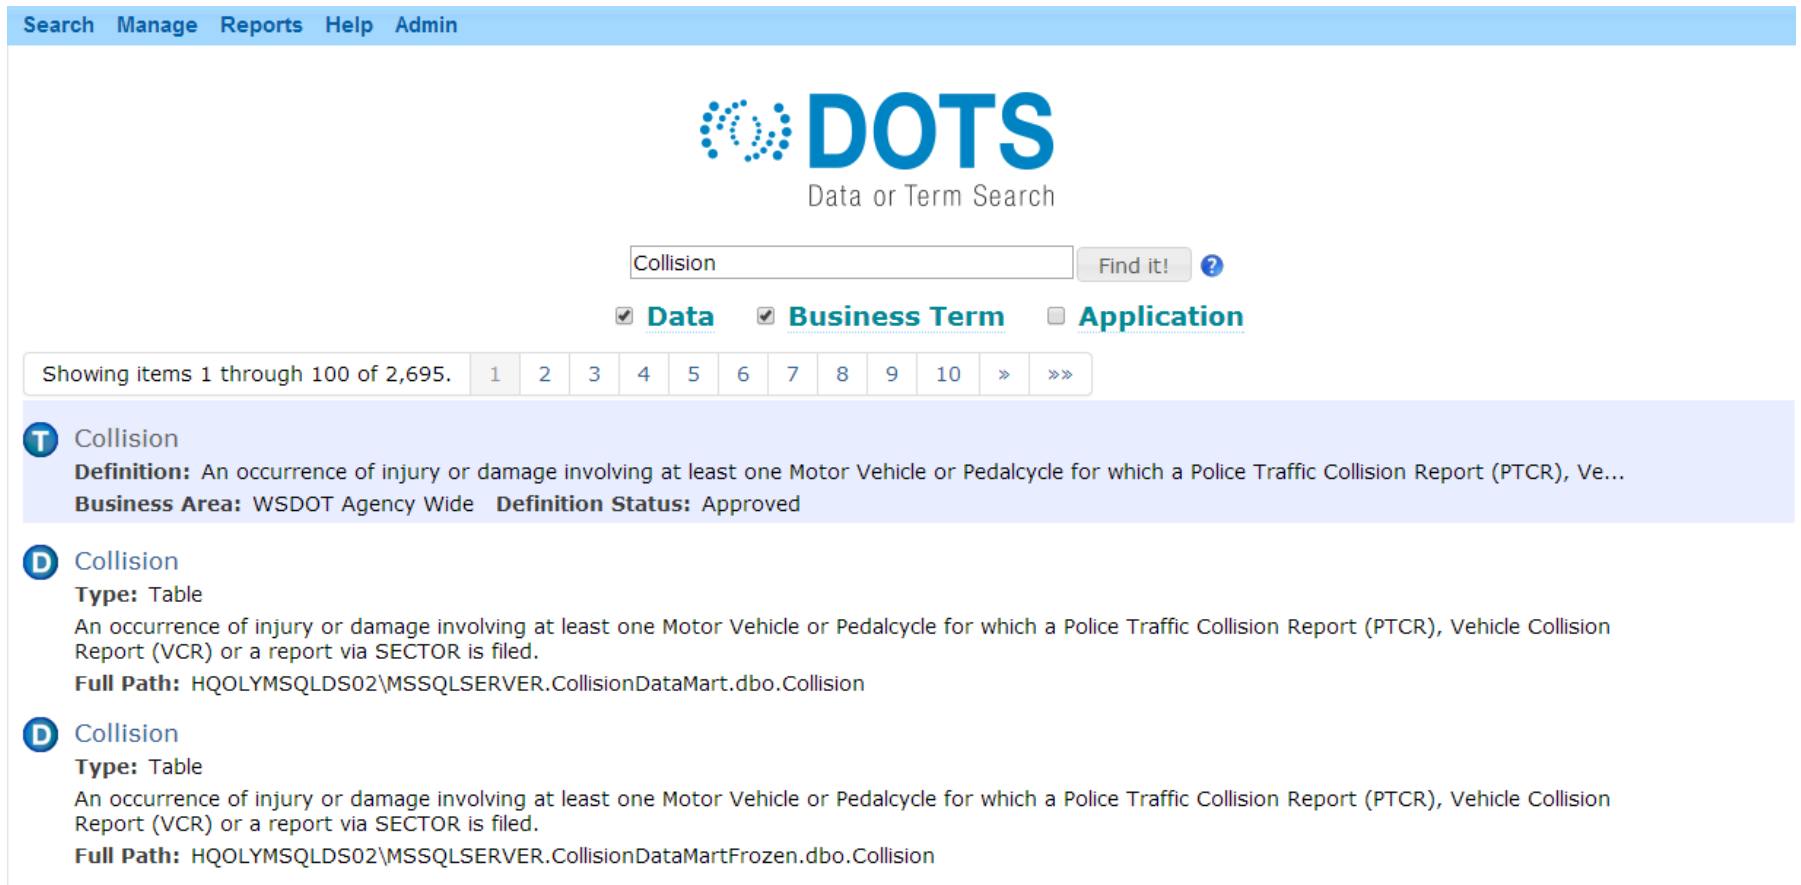
Data Catalog: Washington State Department of Transportation10,11
Washington State DOT developed the Data or Term Search (DOTS) application to create a common data vocabulary across the agency. DOTS describe the database schema, data definitions, and the business stewards – it answers the “What? Where? Who?” questions about the data by describing what data are available, where data are available, and who to go to with questions.
Figure C-5: DOTS Application Screenshot
Source: The Redesigned WSDOT Data Catalog12
Data Catalog: Minnesota Department of Transportation13
Minnesota DOT implemented a data catalog developed by data stewards designated to specific business domains throughout the DOT. The data stewards identified and documented data items within their domains. The documentation included data terms and metadata (approved term name, term definition, source of record, data classification, and responsible data steward). This information was included in the Business Data Catalog, which staff can use. Cited benefits of the Business Data Catalog include helping to prevent data redundancy and to identify opportunities for reuse.
Data Accessibility Approach: Utah Department of Transportation14
Utah DOT has a three-prong approach to making data findable for agency employees and the public. First, the UDOT Data Portal provides access to news, training, applications, and both spatial and non-spatial UDOT data. Second, UDOT Open Data provides a clearinghouse for UDOT’s public data, where users can browse by category (e.g., assets, maintenance, planning, projects, etc.).Third, UPlan serves as UDOT’s map center, where users can search existing maps or create their own.
Linkages to Other TPM Components
C.3 Data Standardization and Integration
TPM activities typically require use of multiple data sets from different sources. For example, in order to understand the relationship between incidents and congestion patterns, the analyst might use data from an incident reporting system together with travel time or speed data. To facilitate analysis, the two data sources should use compatible location references and units of time. Data standardization is also critical for presenting an integrated view of performance across jurisdictions and modes. Collaboration efforts across agencies on performance monitoring and reporting will need to include early discussion of standards for performance measures (see External Collaboration, Component B). Advance planning is important to ensure data standardization; once data are acquired, it may be difficult or impossible to transform it into a standard form.
This subcomponent discusses ways to strengthen organizational capabilities for data standardization and integration.
- Assess data against standards and requirements
- Create and implement a data integration plan
“The wonderful thing about standards is that there are so many of them to choose from.”
Source: Grace Hopper, Computer Scientist
Step C.3.1 Assess data against standards and requirements
A good starting point for data standardization and integration is to conduct a needs analysis. This can involve a systematic review of analysis requirements, identification of data sources that need to be integrated for this analysis, and finally, identification and prioritization of data integration issues.
Common data integration issues include:
- Data entities that are defined in different ways (e.g., different jurisdictions have different definitions of serious injury crashes)
- Data entities that do not have the same attributes (e.g., two districts collect data about their culverts, but use different classification and condition rating methods)
- Data for related entities cannot be joined because they don’t use consistent link fields (e.g., maintenance work is recorded by highway system and shed identifier; construction work is recorded by project ID)
A variation on the third case above is use of different coding systems for a given attribute. For example, there may be different systems for locating an asset or activity along a road (e.g., construction stationing versus intersection-offset versus milepost).
Data standards are especially important to define for spatial and temporal referencing. These two dimensions provide the foundation for looking at patterns and relationships across data sets (e.g., truck traffic and pavement condition, weather and crashes, etc.) Where standards or “master” sources of values for these items exist, the needs assessment can determine which data sets are in compliance with these standards. Where standards do not exist, current variations in classifications and referencing methods can be reviewed to provide input into possible establishment of standards.
In some cases, crosswalks or mappings can be established across different coding or classification systems. For example, in many states, a county identifier can be used to derive the district or region.
Examples
The table lists commonly used data references that, when used inconsistently across data sets, can impact the agency’s capabilities as described in the second column.
Source: Federal Highway Administration
| Data Linkage | Available Tools |
|---|---|
| Spatial: Linear Referencing |
|
| Spatial: Coordinate Referencing |
|
| Spatial: Zone Systems |
|
| Asset Identification |
|
| Project Identification |
|
| Work of Expenditure Category |
|
Linkages to Other TPM Components
- Component 05: Monitoring and Adjustment
- Component 06: Reporting and Communication
- Component A: Organization and Culture
- Component B: External Collaboration
- Component D: Data Usability and Analysis Capabilities
Step C.3.2 Create and implement a data integration plan
Based on the needs assessment, a prioritized data integration plan can be established – considering both what types of integration will have the most impact, and which are easiest to tackle.
The data integration plan should consider the following strategies:
- Adoption of agency data standards – these may be national standards (e.g., the Model Inventory of Road Elements or MIRE) or agency-specific standards. Standards provide a common reference for defining data entities and their attributes. As noted above, standards for location referencing are important to include.
- Formal designation of the single authoritative “source system” for each type of data to be integrated.
- Developing and maintaining a high level agency-wide data model that shows integration points between major types of data entities.
- Creation of boilerplate requirements language to ensure that new applications adhere to the agency’s data standards.
- Centralized management of common code lists – with processes to keep these in sync across disparate applications.
- Data and application modification – to make existing databases and supporting applications conform to standards. These modifications may be relatively straightforward or more complex, depending on the nature of the application.
- Data conversion or mapping services – development of standard conversion routines (e.g., to assign a district given a county, assign a timestamped event to a fiscal year or convert a linear reference to an X,Y coordinate).
- Creation or expansion of data warehouses that use Extract-Transform-Load functions to pull data from multiple sources and perform necessary conversions to get data in a standardized form.
- Development of reports that pull data from different sources and perform necessary linkages and conversions on demand.
- A change management strategy that includes processes to ensure that when data structures are modified in source systems, dependent systems and reports don’t break. Metadata repository tools can be helpful here – as they can maintain information about which attributes are included in different data tables.
An advantage of developing a data integration plan is to identify common integration needs that can be addressed through standardized solutions – rather than as a series of independent projects to meet needs as they arise. This may require up-front effort but will save time in the long run and will lead to greater consistency and a reduced data maintenance burden.
It is important to keep in mind that adopting a data standard and making sure that current (and future) data sets comply with the standard are two distinct activities. There can be both technical and organizational barriers to data standardization that should be recognized during the process of standards development and adoption. Assigning the right people with the right skill sets for supporting and enforcing standards implementation is essential to success. Both technical skills related to data architecture and organizational skills are needed. In addition, agencies should schedule a regular process of monitoring plan implementation and modification as needed based on progress made, new opportunities, and changes in priorities.
Examples
Standardized Linear Referencing System: Idaho Transportation Department15,16,17
The Idaho Transportation Department (ITD) now uses a commercial linear referencing system product to synchronize location information across separate systems that manage bridge, safety, and traffic data. Prior to the implementation of the commercial system, ITD had used the MilePoint and Coded Segment (MACS) LRS, a mainframe-based attribute system. Implementation of the commercial system resulted in reduced high mainframe maintenance costs, automated event location stability, and the elimination of “data integration by memo” so that changes to the LRS are automatically reflected throughout the system. To integrate the data, ITD created new data standards and data maintenance rules in order to resolve temporal issues. The new data standards and maintenance rules enabled ITD to provide capabilities to correct temporal mistakes and convert temporal events.
Centerline Data Standard: Oregon Department of Transportation 18
Oregon DOT has developed a statewide Road Centerline Data Standard, with the goals to:
- Ensure the compatibility of data sets within the same framework feature set and between other framework feature sets and themes;
- Assist agencies responsible for the creation, maintenance, and distribution of road centerline data sets by reducing the costs of data sharing, data development, and data maintenance between road authorities; and
- Ensure that road centerline attribution (including geometry) is as up-to-date, complete, and accurate as possible by relying on local road authorities’ expertise and data quality mandates
Work on the data standard began in 2004, and Oregon DOT adopted the standard in 2006, with only minor changes since then. The data standard describes the elements and data structure necessary to adequately describe, produce, and use road centerline data produced in Oregon. It does this through a core set of geospatial information and geometry to support the need for an accurate and current representation of Oregon’s traveled road infrastructure
Initial applications of the road centerline data include route-milepost and address range methods of linear referencing, and digital interaction between the road centerline data set and the hydrography data set(s). Future applications could include network connectivity solutions to support oversize vehicle routing, emergency response, and planning for intelligent transportation system deployments.
Figure C-6: Oregon DOT Centerline Data Standard
Source: Oregon Geospatial Enterprise Office19
Linkages to Other TPM Components
C.4 Data Collection Efficiency
Assembling a complete and useful picture of performance levels and causal factors requires a large and complex body of data. Collecting, managing and processing data to support transportation performance management requires significant expenditures – both in terms of direct data collection expense and agency staff time. In some cases, multi-agency collaboration is necessary – for example, assembling performance data for all National Highway System facilities, or for a multi-state corridor. Active planning and coordination both within agencies and across agencies is required to ensure that data collection is pursued in an efficient and coordinated fashion. This subcomponent will assist agencies in efficiently collecting useful data for transportation performance management.
This subcomponent discusses ways to strengthen organizational capabilities for data standardization and integration.
- Identify opportunities for data collaboration.
“As I discussed what was possible with maintenance, traffic, safety, planning, our GIS staff and other key members of our leadership team, it became readily apparent that different departments were collecting duplicate data sets and that working together we could invest in a data set worthy of the UPlan system and our asset management goals.”
Source: Stan Burns, Utah DOT
Step C.4.1 Identify opportunities for data collection
Data collaboration opportunities can be pursued to lower costs of existing data programs or to investigate ways of tapping in to additional data sources to supplement what is already collected. With respect to existing data programs, a logical starting point for identifying opportunities for data collection efficiencies is a compilation of existing initiatives and their costs. This information can help the agency to target areas with substantial costs.
Specific opportunities can be sought for data collaboration in order to make best use of available resources. These may include:
- Consolidating data collection initiatives. For example, collection of curve and grade data for safety analysis as part of automated pavement data collection.
- Utilizing videologs or LiDAR imagery to extract multiple data attributes.
- Designating responsibilities for updating data about highway inventory and condition as an integral part of construction project closeout and maintenance management processes to reduce the need for complete re-collection of data.
- Establishing a data clearinghouse that facilitates sharing of data collected by multiple agencies.
- Maintaining an agency data catalog and requesting that staff check existing data availability prior to embarking on new data collection efforts.
- Establishing data sharing agreements with private sector organizations. For example, to obtain real-time travel information in exchange for information about construction schedules and reported incidents.
- Collaborating with regional partners to share costs of acquiring data sets of common interest.
- Coordinating data collection across multiple jurisdictions through a regional or statewide body that sets standards and provides support for consistent data collection and reporting, and consolidates the reported data.
Once appropriate strategies are identified, work will be required to negotiate agreements. Data sharing agreements need to articulate processes, roles, responsibilities, and financial arrangements (each party’s contribution – both direct and in-kind). Negotiations will typically also involve discussions to ensure that each party’s data requirements will be addressed – considering accuracy, precision, and fit with reporting and analysis timetables.
Many data sharing strategies depend on – or can be facilitated by – information technology investments. These can range from relatively simple data portals to specialized applications for data intake, processing, and display. Several examples are provided below.
Examples
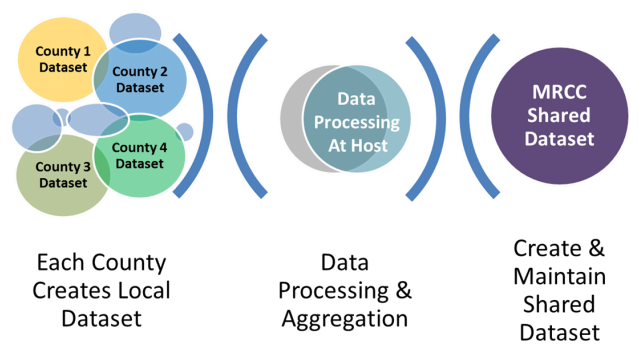
Shared Database: Metro Regional Centerline Collaborative (MRCC)20:
The MRCC is a joint collaborative project started in 2014 that involves GIS technical and managerial staff from the seven-county Minneapolis-St. Paul metropolitan area, the Metropolitan Emergency Services Board, and the Metropolitan Council. This group is facilitating the development and maintenance of an authoritative, inter-jurisdictional, publicly available road centerline data model and data set. It is doing this by having each county provide data according to specified standards (i.e., counties “control” their south and west borders and “cede” their north and east borders when edge-matching roads to boundaries).
Once completed, intended use of the data model and data set will include:
- Vehicle routing;
- Address geocoding;
- Next Generation 911 call routing and location validation;
- Emergency services dispatching;
- Linear referencing system use; and
- Cartographic road feature representation.
Figure C-7: MRCC Data Assembly Process
Source: MRCC Regional Data Maintenance Project21
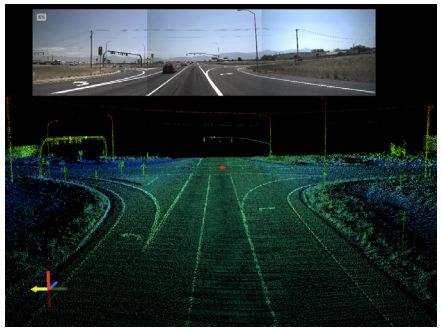
LiDAR Data Collection: Utah Department of Transportation:22
Utah DOT initiated a LiDAR data collection effort in 2011. This effort involved pooled funding across multiple departments to collect data used for asset management and related business needs. Gathering multiple types of information at the same time lowered overall data collection costs for the agency. The data included pavement condition, roadway geometrics, and roadway asset inventory.
Figure C-8: LiDAR Data Collection
Source: Utah Department of Transportation23
UPlan: Utah Department of Transportation24:
Utah DOT has created the UPlan interactive mapping platform to improve data sharing. UDOT can integrate any publicly available spatial data into UPlan. Stakeholders can also share geospatial layers with UDOT, which improves collaborative decision-making by ensuring that the agency and stakeholders can view the same information (e.g., for assessing project impacts). UDOT can change access permissions, enabling it to use and share different data sources securely.
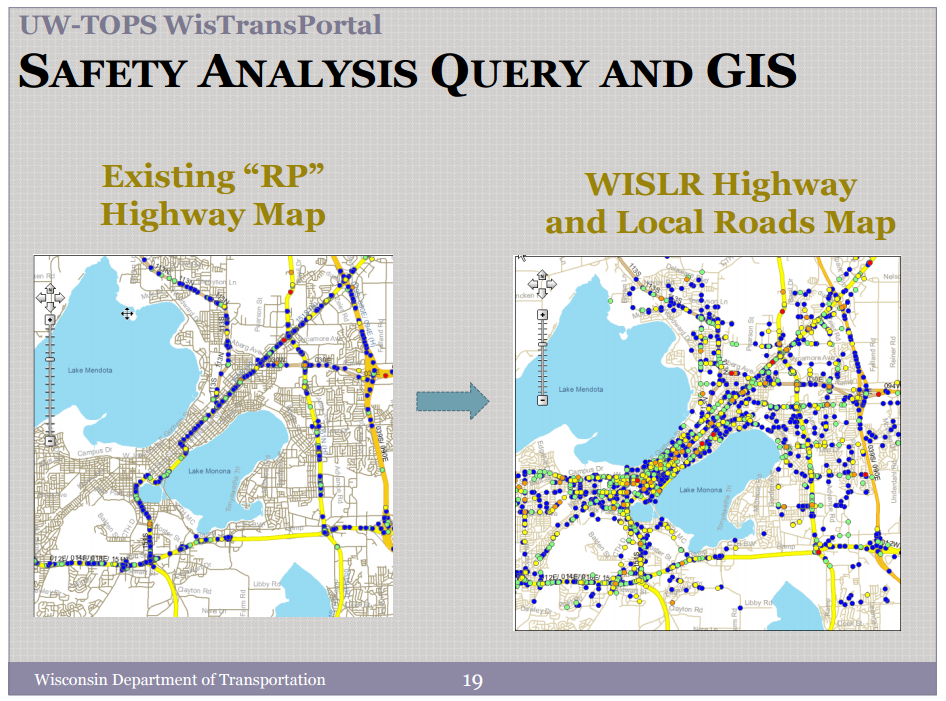
Local Road Data Management Tool: Wisconsin Department of Transportation25
The Wisconsin Department of Transportation has developed the Wisconsin Information System for Local Roads (WISLR) to manage local road data. The internet-accessible system combines local road data with interactive mapping functionality. It allows local governments to report local road information (e.g., width, surface type, surface year, shoulder, curb, road category, functional classification, pavement condition ratings) to Wisconsin DOT and then use WISLR’s analytical tools, including mapping and tabulations. Local governments can update and edit their data. This system leads to statewide collaboration in which both the Wisconsin DOT and the local governments benefit from each other.
Figure C-9: WisDOT Safety Analysis Tool
Source: Wisconsin Department of Transportation26
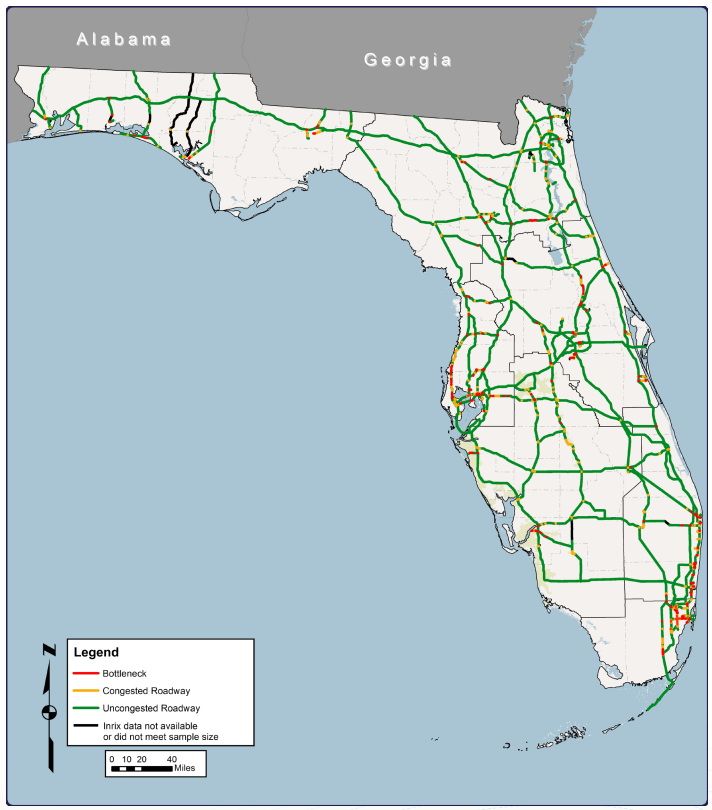
Using Private Sector Data: Florida Department of Transportation27
In 2011, Florida DOT studied bottlenecks on its Strategic Intermodal System using vehicle probe data and travel time reliability measures. The private vehicle probe data combine real-time data from traditional sensors, GPS-enabled vehicles, and other factors. The GPS-enabled vehicles include trucks, taxis, buses, and passenger cars that have onboard GPS devices and a capability to transmit speed and location back to a central location anonymously. Florida DOT purchased this speed data in five-minute intervals for a one-year data period, which included 711 million records. Based on these data, Florida DOT was able to calculate performance measures related to travel time and congestion, and identified bottlenecks in the state’s Strategic Intermodal System.
More recently, Florida DOT negotiated a data sharing agreement with a different private navigation services provider. Under this agreement, the private provider allows FDOT access to real-time travel and incident data. In return, FDOT allows the private provider to use the agency’s data within its app.
Figure C-10: FDOT Public/PRovate Traffic Data Sharing
Source: Florida Department of Transportation28
Regional Data Coordination: Michigan Asset Management Council
The Michigan Transportation Asset Management Council (TAMC) was established to expand the practice of asset management statewide to enhance the productivity of investing in Michigan’s roads and bridges. One of the TAMC’s key functions is coordination of collection of physical inventory and condition data on all roads and bridges in Michigan. Each member agency must report to the Council the mileage and condition of road and bridge systems under their jurisdiction. The Council establishes data standards, data collection processes and tools for each agency to use, and consolidates the information that is collected. The Council’s role and authority was established through Michigan state law (Act 51).29
Linkages to Other TPM Components
C.5 Data Governance
Data governance is the mechanism by which data-related decisions are made. It allows agencies to define standard data management practices and ensure that they are carried out in a consistent fashion. Strong data governance is integral to the success of initiatives to improve data quality, integration and access. Every agency already has policy and decision making structures and authorities in place. Data governance can build on these existing structures to formalize policies, roles and responsibilities related to data. This subcomponent covers key activities to consider for strengthening data governance in support of TPM.
This subcomponent discusses ways to strengthen organizational capabilities for data standardization and integration.
- 1Define roles and accountability
- Implement governance structures and policies
“A data governance framework helps to strengthen the overall data management process within an organization by defining the roles and responsibilities for data stewards, data architects, data coordinators and business owners, along with other data stakeholders within the context of the existing organizational structure.”
Source: Minnesota Department of Transportation, Data Business Plan
Step C.5.1 Define roles and accountability
A good starting point for data governance is to document current data roles. This will provide an understanding of the current baseline situation, and will help to uncover gaps and ambiguities in responsibilities. Once current roles are understood and gaps identified, the agency can move toward standardizing and formalizing roles and making sure that accountability for these roles is established. This process will help equip the agency to proactively address its data needs.
Agencies can choose to focus data governance efforts on a small number of critical data sets for TPM, or to take a more comprehensive approach. The first step is to create a list of the data sets of interest. For TPM, these may include pavement and bridge inventory and condition data, traffic data, crash and fatality data, road inventory data, capital program data, network model data, analysis results, etc. Then, for each of these data sets, identify:
Data Stewardship Responsibilities:
- Who is responsible for defining what data should be collected/produced and how – the data elements, the frequency of collection/production, and the methods of collection/production?
- Who is responsible for defining data validation rules?
- Who is responsible for quality review and acceptance of the data?
- Who is responsible for answering questions about the meaning, derivation and limitations of the data?
- Who is responsible for creating and maintaining business metadata?
- Who is responsible for deciding who can access the data and approving special data requests?
Data Custodian Responsibilities:
- Who is responsible for setting up and managing the hardware and software for managing the data?
- Who is responsible for loading the data into a database or repository for access?
- Who is responsible for creating and maintaining technical metadata?
- Who is responsible for setting up data access environments (e.g., reporting tool configuration)?
- Who is responsible for fulfilling data requests?
- Who is responsible for data cleansing (e.g., applying data validation rules)?
- Who is responsible for backing up the data?
From the perspective of data governance, it is useful to distinguish points of accountability for each function; it is not necessary to exhaustively identify each individual who is involved.
While not all of these questions will be applicable to each data set, they can be used to identify business units and positions within these units who currently play stewardship and custodial roles for data. Typically the custodians will be located in an information technology or data management unit – but not always. In many cases, the same individual will serve as both a data steward and a data custodian. Documentation and formalization of data roles will identify key points of contact for each data set. It is also likely to lead to productive discussions about formalizing accountability in areas that are currently not well defined. Roles and responsibilities should be documented, and ideally built into employee position descriptions so that the responsibilities are clear, defined, and viewed as an integral component of an employee’s job.
It is important to note that defining data management responsibilities and designating staff to be accountable for these responsibilities is a necessary but not sufficient step. Staff assigned to various data roles must have sufficient time, training, and authority to carry out their responsibilities.
Examples
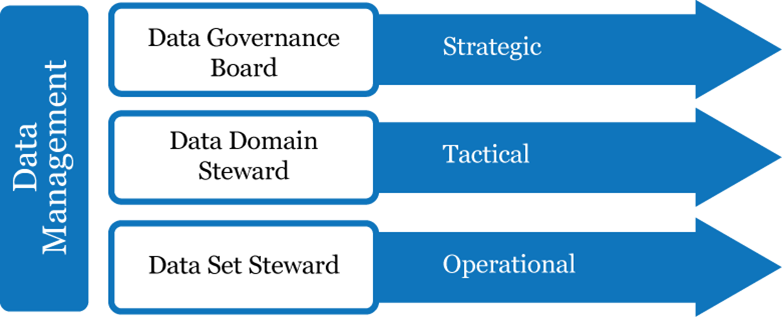
Data Stewardship: Minnesota Department of Transportation30:
As part of its efforts to strengthen data governance, Minnesota DOT established data stewardship roles and responsibilities in a variety of data domains.
These domains include:
- Human resources data
- Financial data
- Planning, programming, and project data
- Business and customer data
- Spatial data
- Regulatory data
- Recorded events data
- Supporting assets data
Within these domains, Minnesota DOT has identified 120 subject area stewards. These stewards meet monthly along with a representative from the statewide Information Technology group.
The focus of steward responsibilities to this point has been on:
- Scoping information technology projects in the context of identified data principles to minimize redundancies and foster discussion of how a project in one area may have broader impacts on other areas or data systems in the department
- Identifying enterprise and authoritative sources of data and clarifying ownership responsibilities
- Discussing data retention needs and policies
- Reviewing data access policies
- Identifying data sharing opportunities within and external to the department and developing service level agreements to establish expectations.
Figure C-11: MnDOT Data Management
Source: Data Business Plan31
Linkages to Other TPM Components
Step C.5.2 Define roles and accountability
Step C.5.1 emphasized a “bottom-up” approach, i.e., documenting and formalizing data stewardship and management roles at the level of individual data sets. In order to make sure that the agency is equipped to make new data investments and improvements that are cross-cutting in nature, a “top down” agency-wide structure for data governance can be helpful. An agency-wide structure will typically involve a high level strategic group with representation of different divisions (both business and IT) to set policy and make key investment decisions. It will also involve a more tactical team responsible for policy execution, data strategy and solution development and coordination. For the strategic level, agencies can choose to establish a new data governance council or it can piggyback on already existing leadership teams. Similarly, an agency may already have a data management unit that can provide tactical support – or a new data governance team can be designated.
Data policies provide the basis for moving from an ad-hoc approach to data management to a more consistent and repeatable approach. For example, if the agency wants data to be integrated based on spatial location, policies need to be established that require business units that collect data to adhere to location referencing standards.
The following types of data policies can be considered:
- Policies that define responsibilities of data stewards and custodians
- Policies that reference data standards to be followed
- Policies that specify where different types of data are to be stored
- Policies that specify how different types of data are to be made available
- Policies that define how data access is to be managed
- Policies that define data quality management processes to be followed
- Policies that define a process to be followed prior to new data collection (i.e., verify that the new data doesn’t duplicate existing data, and that a strategy for management and updates has been established)
- Policies that define data change management processes
- Policies that encourage data sharing
- Policies that define sensitive and confidential data and ensure protection of these data types
- Policies that require minimum metadata and designate where that metadata should be stored
Policies can be defined and rolled out incrementally, based on where the biggest issues are that impede data quality, integration, and access.
Each policy should have a well thought-out implementation plan that considers likely barriers to acceptance, such as:
- Lack of understanding about why the policy is needed and what benefits it provides
- Lack of direction on how to implement the policy
- Lack of resources to make additional effort that is not critical to the mission of an individual business unit
- Lack of tools to facilitate policy adherence (e.g., a metadata repository)
- Lack of management willingness to enforce the policy
Overcoming these barriers will require initial and ongoing steps to ensure management buy-in (at multiple levels), development of support documents, such as “how to” guides, allocation of staff time to meet with and support individuals who are impacted by the policy, and (in some instances) implementation of new tools. A periodic review of policies and their implementation will be helpful for identifying ways to address lingering issues.
Examples
Knowledge Management Governance Oversight Committee: Colorado Department of Transportation32:
The Colorado DOT established a Knowledge Management Governance Oversight Committee, whose vision was to implement policies, procedures, and standards to be used to manage information, data and content within Colorado DOT.
The Committee is responsible for developing a strategy and process to implement knowledge management governance throughout the organization, including:
- Prioritizing direction for governance implementation and prioritizing governance tasks;
- Guiding the development of a governance manual to document the framework
- Developing a plan to communicate the data governance initiative throughout the agency; and
- Developing a process for change management and training to support the data governance initiatives.
The Committee is also responsible for creating and recommending a governance framework, which would:
- Define governance roles and responsibilities;
- Define goals and objectives for data, information, and content creation, retention, distribution, and use;
- Identify the value, use, and priority of information, data, and content; and
- Define requirements for a knowledge catalog development for the agency.
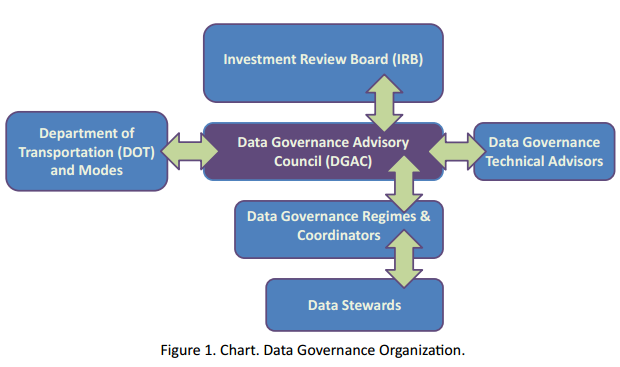
FHWA Data Governance Plan33
FHWA is in the process of developing a plan for agency-wide data governance. The first volume is complete, providing a “Data Governance Primer.” Additional volumes of the FHWA data governance plan, when complete, will address enterprise architecture, data analytics and storage, master reference data, and open data. The plan currently provides a hierarchical framework for data policies, standards, and procedures. The policies are high-level outcomes consistent with strategic goals and objectives (e.g., “FHWA data are an enterprise asset”). The data standards provide additional detail on policy implementation and can cut across multiple policies (e.g., “Data Definition Conformity: Data Definitions must be established and specified between mapping entities and variables”). Finally, the data procedures provide further detail on applying data rules. The FHWA data governance efforts have a three-tier hierarchy consisting of the Data Governance Advisory Council, Data Governance Regimes and Coordinators, and Data Stewards.
Figure C-12: FHWA Data Governance Structure
Source: Federal Highway Administration34